Description
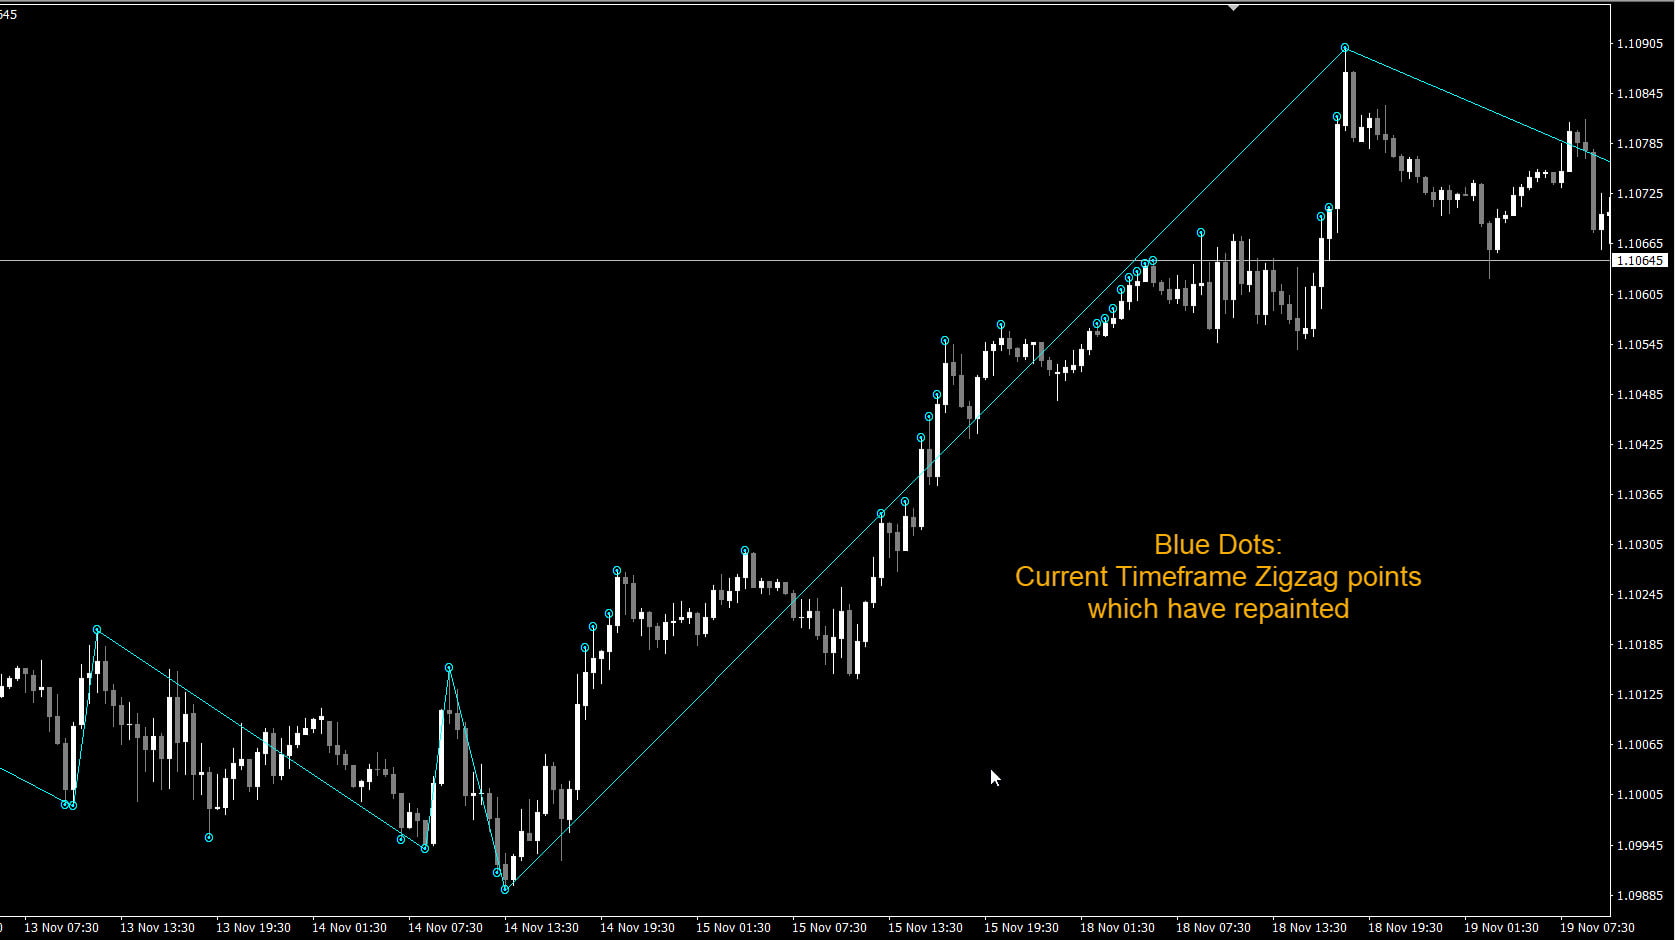
This indicator shows Zigzag repainted arrows as non-repainting dots for 3 timeframes.
So you get a sense of actual zigzag points and how many times it repainted.
The blue dots will be non-repainted. It’s a Multi-timeframe version.
Original Multi Zigzag version:
https://www.mql5.com/en/code/8536
How It Works:
On first time loading, you won’t get blue dots.
But as the indicator runs, and zigzag keeps shifting, it will make the dots everytime zigzag repaints.
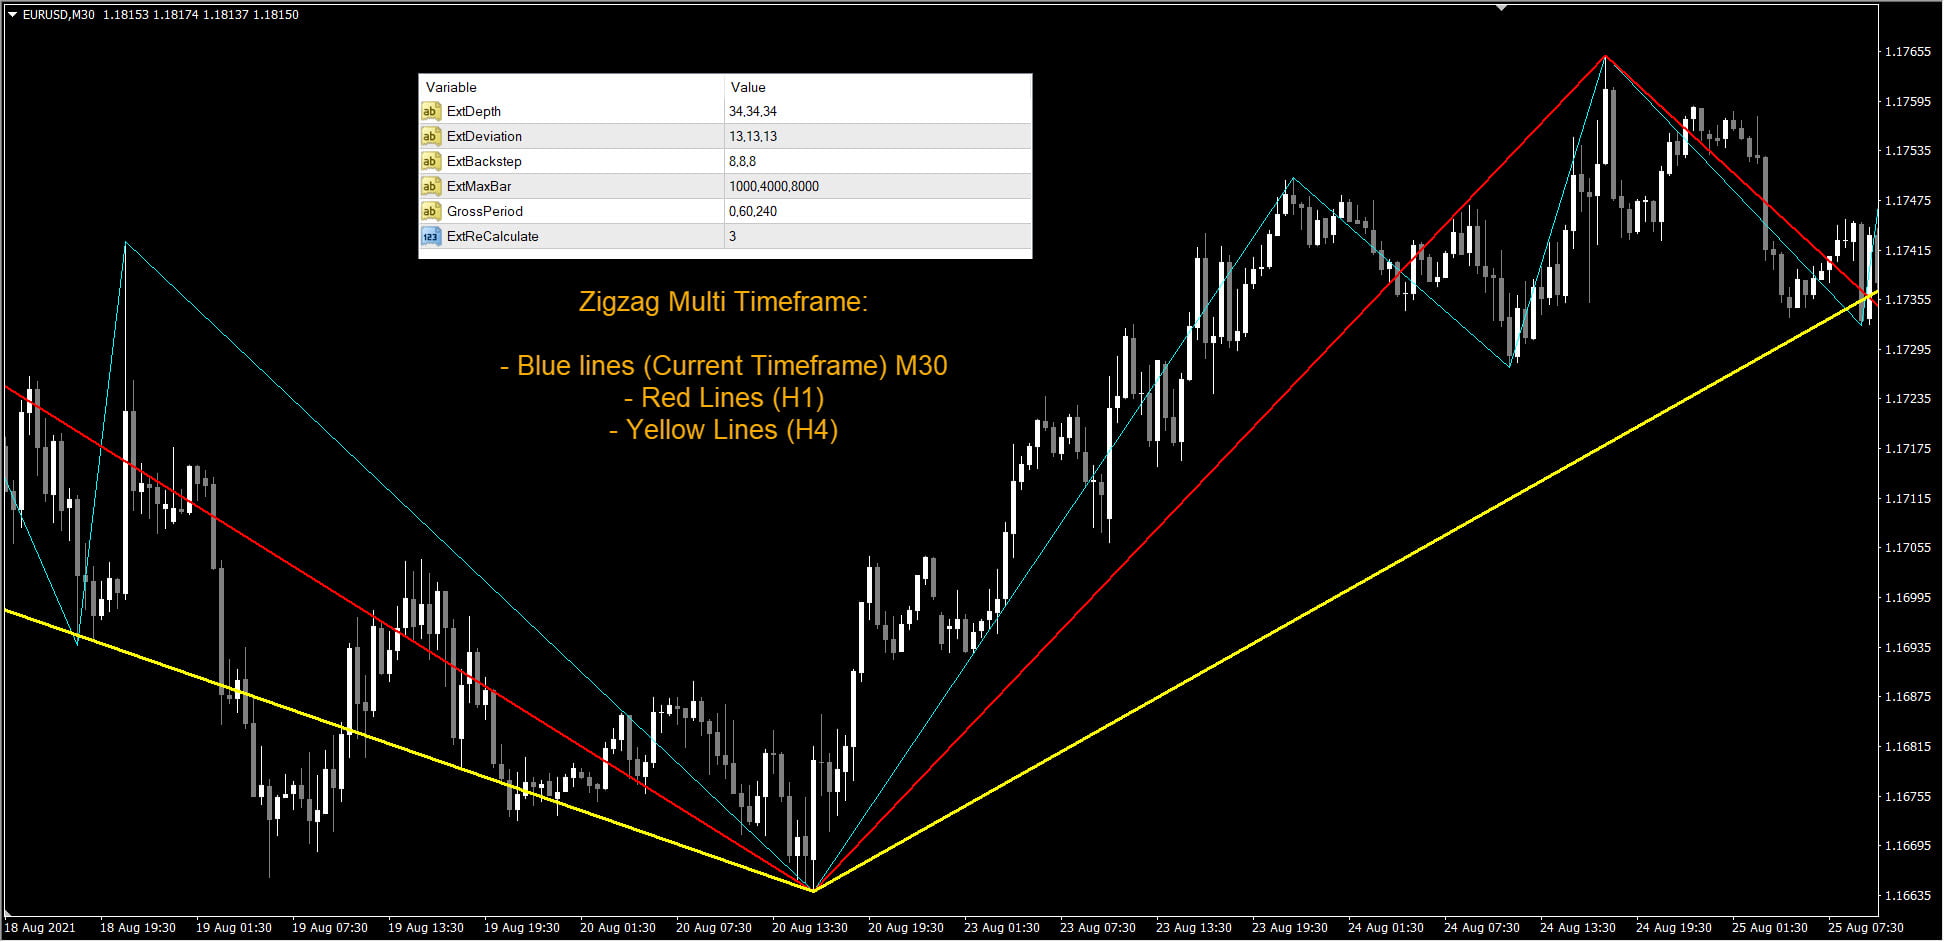
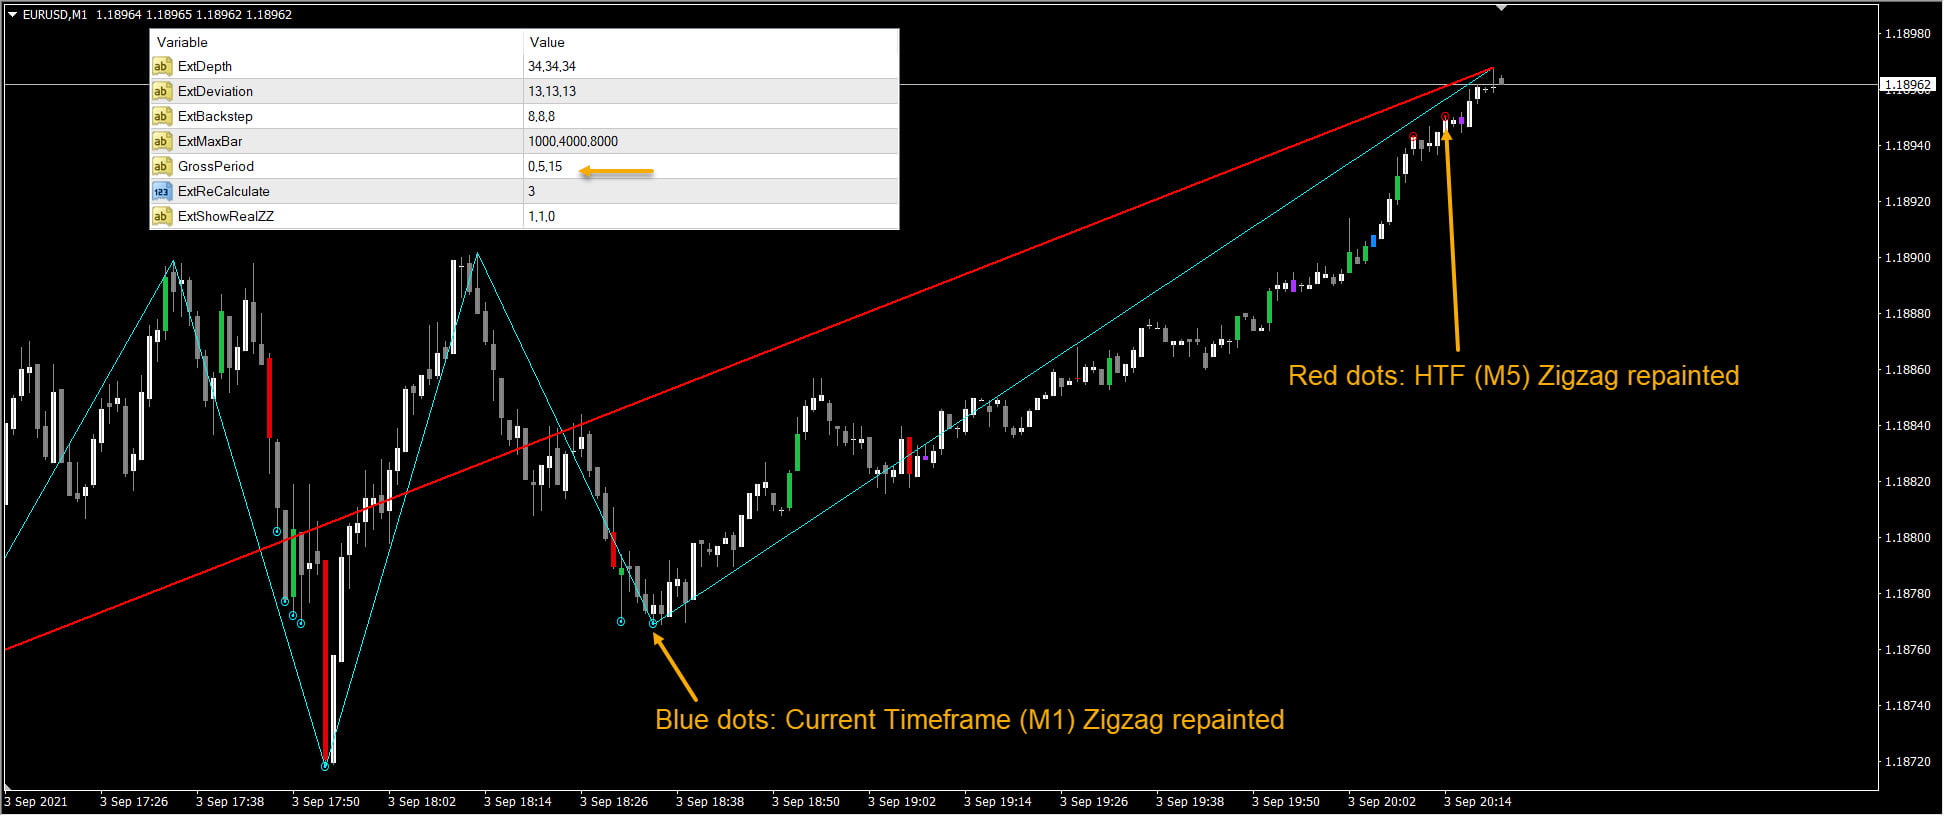
Suppose comma-separated Timeframes in “GrossPeriod” are 0,5,15. And Current timeframe is M1.
The blue lines and blue dots are for M1, red lines and red dots are for M5. Yellow lines and dots are for M15.
If you reload the indicator, or make changes to settings, it will refresh again. And dots will form as zigzag keeps progressing.
No alerts will be available. Since this indicator is only to visually see how many times Zigzag has repainted.
Settings:
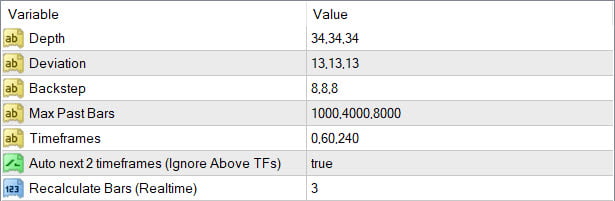
If “Auto Next 2 timeframes” true, then auto calculate 3 timeframes as:
Current, next higher and next higher. So, if current is M5, then timeframes will be: M5,M15,M30
And the Timeframes list will be ignored.
Please note that some settings names were changed in v1.1
So, some screenshots might have old settings names.
Changelog:
v1.0 Base version
v1.1 Added Auto Next timeframes based on current TF