Abiroid Slopes Histogram

Description:
Abiroid Multi Slope indicator allows you to calculate a Slope Histogram for any line of any indicator.
Histogram is for 1 slope line only, but slope values can be calculated for 3 lines total. To have multiple histograms, add as many Slope’s for custom indicators as you like on chart.
You just need to provide the Indicator name, buffer value, slope’s period and max number of bars back.
This is indicator is for sale here:
https://www.mql5.com/en/market/product/62907/
By default it has slope calculation for TDI Alerts v4.ex4 indicator.
Download extras:
Settings:

- Main Indicator: Any ex4 with a path relative to MQL4/Indicators folder. Suppose, “TDI Alerts v4.ex4” is placed inside MQL4/Indicators/TDI folder. So default specified value will be “TDI/TDI Alerts v4.ex4”
In order to calculate slope, you need to specify any Custom indicator for which you have an ex4.
Note: This does not work for Metatrader’s in-built indicators, unless you have an ex4 file for them.
Also there is no way to specify parameters for the custom indicator.
So it will be good if you have mq4 of this Main Indicator, to directly change parameters in your custom indicator.
- MaxPastBars: Total number of past bars for which slope is calculated.
- Shift: Starting bar from which slope histogram is calculated. Suppose Shift is 0, it will start at candle 0.
- Refresh After Ticks: Refresh Slope value every few ticks. Keep this higher, in case your Main Indicator is heavy, or else over-calculation might make MT4 hang.
Slope Params:
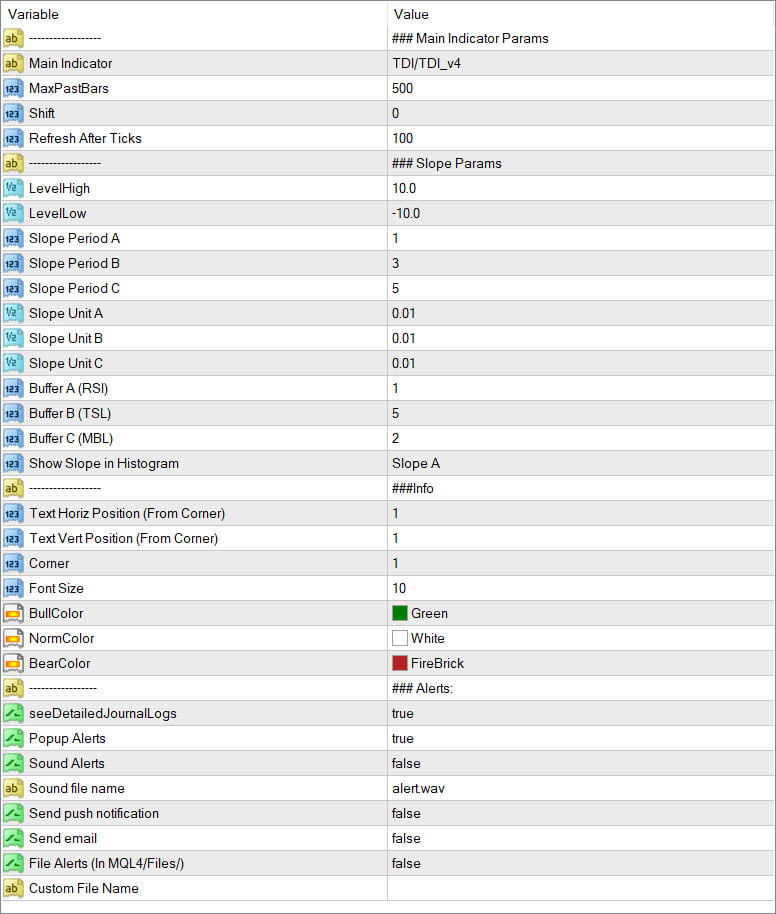
Total 3 slopes can be calculated: Namely A,B,C. By default Slopes are for RSI, TSL and MBL for TDI. Just as an example.

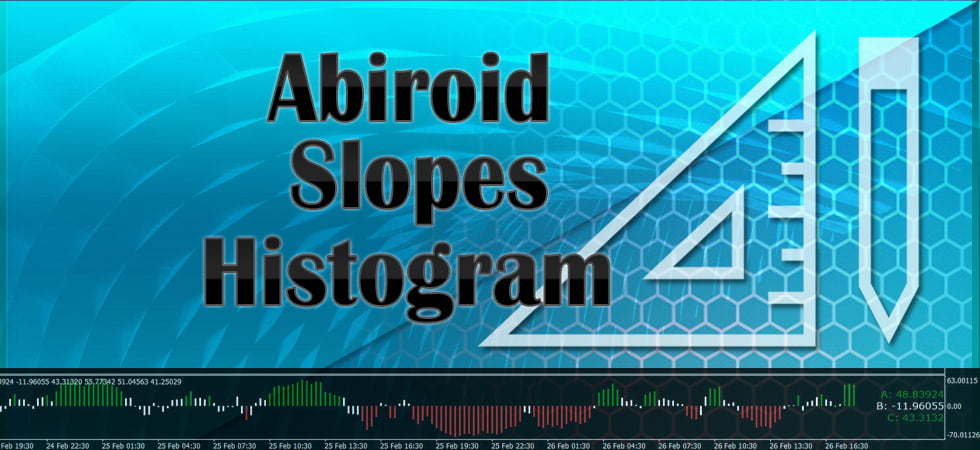
This image is Slope for TDI’s MBL Line.
- Level High: High Level above which Slope in Histogram is marked Green (In above slope it’s set at 20)
- Level Low: Low levels below which Slope is marked Red (In above slope it’s set at -20)
- Slope Period: How many bars between 2 points of the slope.
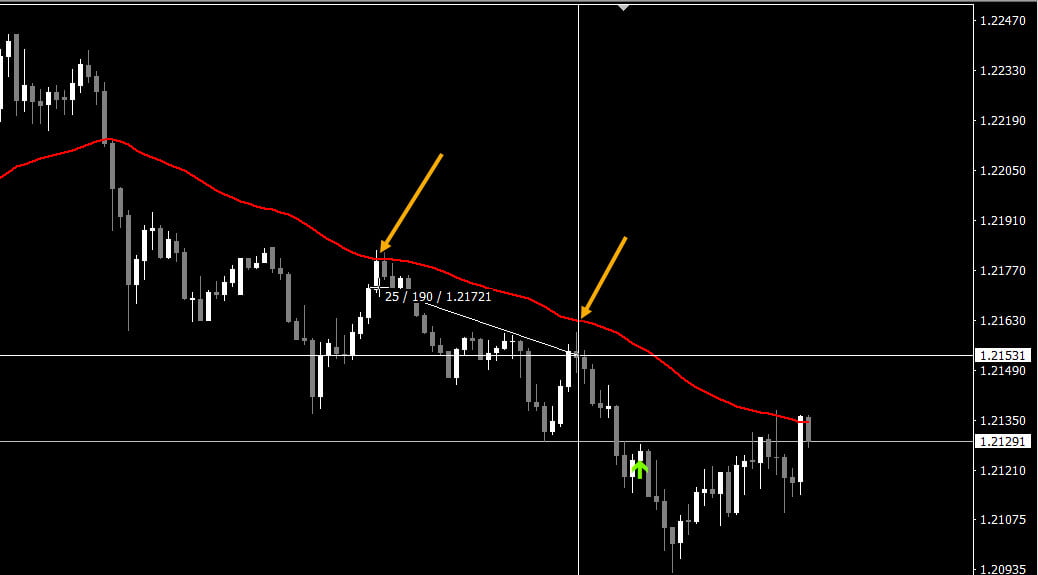
Suppose you are calculating slope of a Moving Average. This red line is a 50-period Moving Average.ex4
And you need the slope of 2 points 25 bars apart. Then you need to specify 25 as slope period.

- Slope Unit: If Slope unit is vertical distance between 2 points for Slope calculation. For TDI, and slope calculations of RSI, MBL and TSL, the unit is best kept at 0.01.
But when using a Moving average, the price point is used as a unit. If you keep Slope Unit as 0, it will use the Pair’s Point as default.
For example: EURUSD, point is 0.00001. USDJPY point is 0.001
- Buffer: The buffer for the line for which you need slope. Best is to check the mq4 code for your Custom Indicator. Because buffers are sometimes hidden.
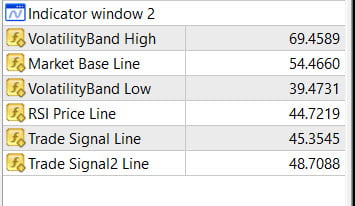
Or if you only have ex4, then use the Data Window to find the Buffer. Note buffer count starts at 0.
Here are the visible buffer’s for TDI_v4:

But as you can see in code, the 1st buffer is None and is hidden:

And actual RSI line is buffer 4. Which is why it’s always advisable to use mq4 files of your Custom Indicator. If slope histogram feels incorrect, most likely cause is that you have an incorrect buffer.
- Show Slope in Histogram: At a time only 1 slope will be visible in a Histogram. But you can add as this Slope indicator as many times to chart as you like. To get multiple histograms.
- Show Slope Info: Set position, corner, font, color, etc. for displaying the slope info for slopes A,B,C
- Alerts: Get Popup, mobile Notifications, email, file etc. alerts
Conclusion:
Slope calculations are very useful in your Indicators and EAs where you need to know the direction a line is taking. For instance an upwards MA indicates UpTrend and downwards MA slope indicates downtrend.
The Slopes for Bollinger Bands on the other hand can indicate if market is trending, if upper band is sloping upwards and downwards band is sloping downwards.
Or if market is ranging, if both band slopes are flattening out. Another good example is Slope of COG center band, which will indicate to trade Buy only if COG bands are moving upwards. And a lot of other such great useful scenarios.
