PSAR Explained with Strategies

About PSAR:
Useful to:
- Capture ongoing trend
- Or to Exit trade position during switch
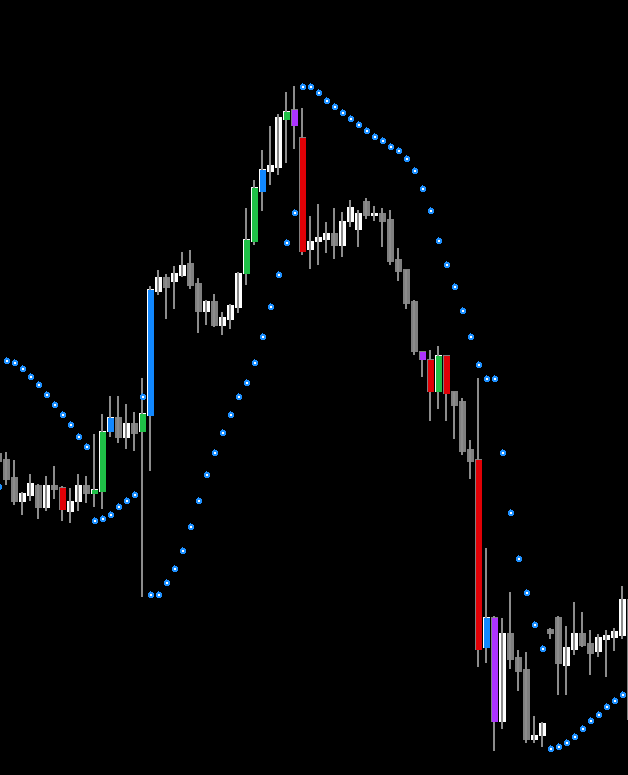
Parabolic SAR (parabolic stop and reverse) is one of the most popular trend-following indicators. Its appeal is that it not only helps in identifying the prevailing trend, but also when the trend ‘stops and reverses’. It prints parabolas (dots) that track the price action accordingly. A bullish parabola will be printed below the price when it is trending upwards, whereas a bearish parabola is printed above the price when it is trending downwards.
A bullish parabola will stop and reverse when the trend turns lower, and vice versa. The parabolas or dots that are below the price, always rise. In comparison, the parabolas above the price will always fall. As a result, these dots track the price of an asset and they are able to pinpoint price reversals when they occur. This makes Parabolic SAR one of the best indicators that can help capture optimal entry and exit points in a trending market.
Parabolic SAR moves with higher acceleration compared to Moving Averages. Which gives quicker signals. But it may change its position in terms of the price while the candle is still forming (Shift 0). So, using Shift 1 makes sure that it is non-repainting.
It is in-built within the MT4 platform in Indicators -> Trend folder.
Scanner Dashboard:
PSAR Strategies:
Parabolic SAR and ADX
The ADX (average directional index) is one of the best oscillators that qualify trend direction as well as momentum. ADX has a centreline at 50, and a reading above this denotes a momentous trend that is worth trading. A reading below 50, signals that a trend is losing steam and the market may start moving sideways. With regards to trend direction, ADX has two lines: the +DI (green line) and the –DI (red line). When the green line is above the red line, it implies an uptrend is in place; and when the red line is above the green line, it implies a downtrend is in place. When combined with the ADX, Parabolic SAR is able to deliver high probability trading signals in trending markets.
Parabolic SAR and Moving Averages
When prices are above a moving average, it means an uptrend is in place; prices below, denote a downtrend. The slope of the moving average indicates how momentous a trend is. Moving average crossovers also help traders spot trend reversals in the market early. With the Parabolic SAR being a lagging indicator, combining it with moving averages can help confirm prevailing trends as well as detect potential reversals early.
Typically a faster 20-period moving average and slower 40-period moving average are used. A trade signal is only generated if the Parabolic SAR signals a trend reversal and the moving averages cross to indicate the same change in trend.
Example 1:
If you have ADX set to true, many times by the time you get a signal price would already go too far.
So, look for a small range right before the breakout bar which made the ADX go up.
And for Buy signals, set a BUY Limit order right above the range.
For Sell Signals, set a SELL Limit order right under the range.
Like this:
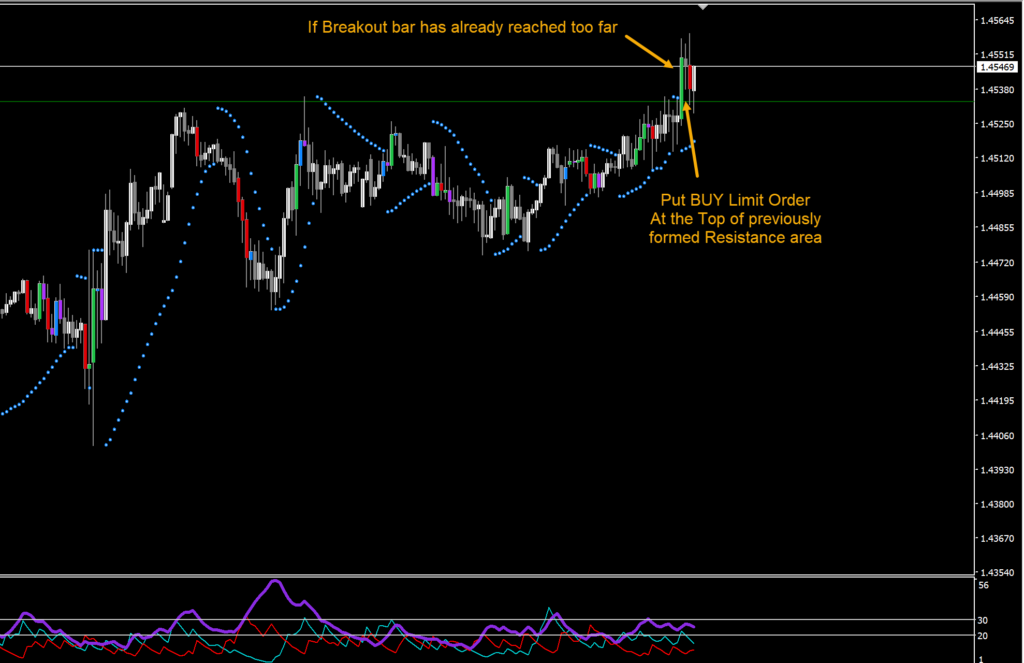
In this example, the strong Green bar is breakout bar:
When PSAR has switched, ADX is in range 20-30 +DI > -DI
MA has just stacked. And 2 HTF PSAR have now aligned.
But this breakout bar has already reached too high. So, price should most likely retrace back slightly within the next 3-4 bars.
It is safe to keep a BUY Limit order at the Green line. Because right before strong green breakout bar, price was slightly ranging.
But now the trend has started. And also keep an expiry timer for just 3-4 bars.
And in next few bars, as we see in this example, price comes down and hits the Buy order. And starts going up again.
With this strategy, it is very important to keep a very close stop loss.
And since this is a scalping strategy, keep Take Profit at 1-2 times more than stop loss distance.
And make sure not to trade this near important news events.
Indicators:
ADX and PSAR are in-built in MT4.
Volume:
Example 2:
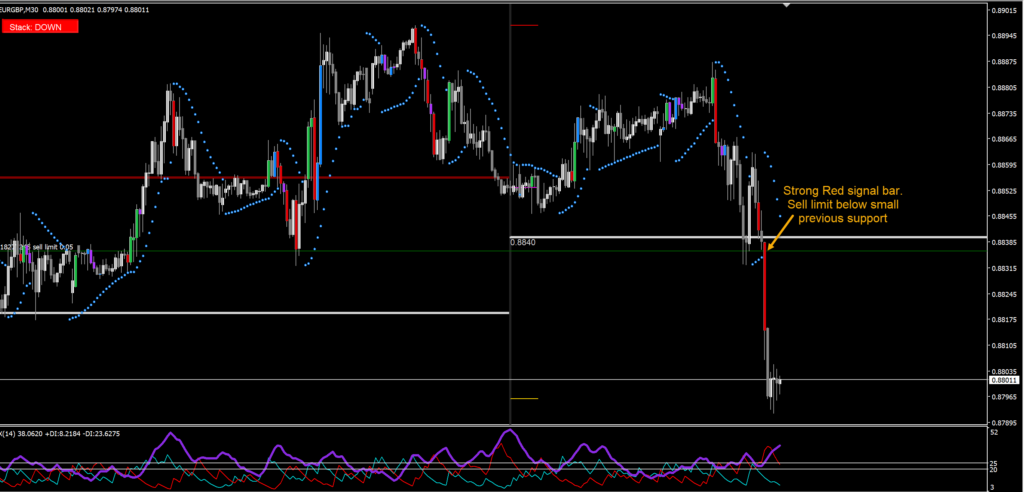
Sometimes you might miss the signal. But it’s better to skip trades than to be late in a trade and face a loss:
Another thing to check is: if strong breakout bar has broken through a Pivot level.
In that case place a Limit order near that Pivot level. For Buy Limit order, place it slightly above Pivot.
And for SELL Limit order, place it slightly below the Pivot.
Pivot levels are like magnets, and a range forms near them a lot of the times.
Even after a pivot level breakout, price might still retrace back to it.
In the above missed example, there was a News event which gave that really long down trend.
So, be careful trading near News Events.
And same way, don’t trade this strategy during very slow low volatility markets.
Pivots:


