Darvas Boxes Settings Explained

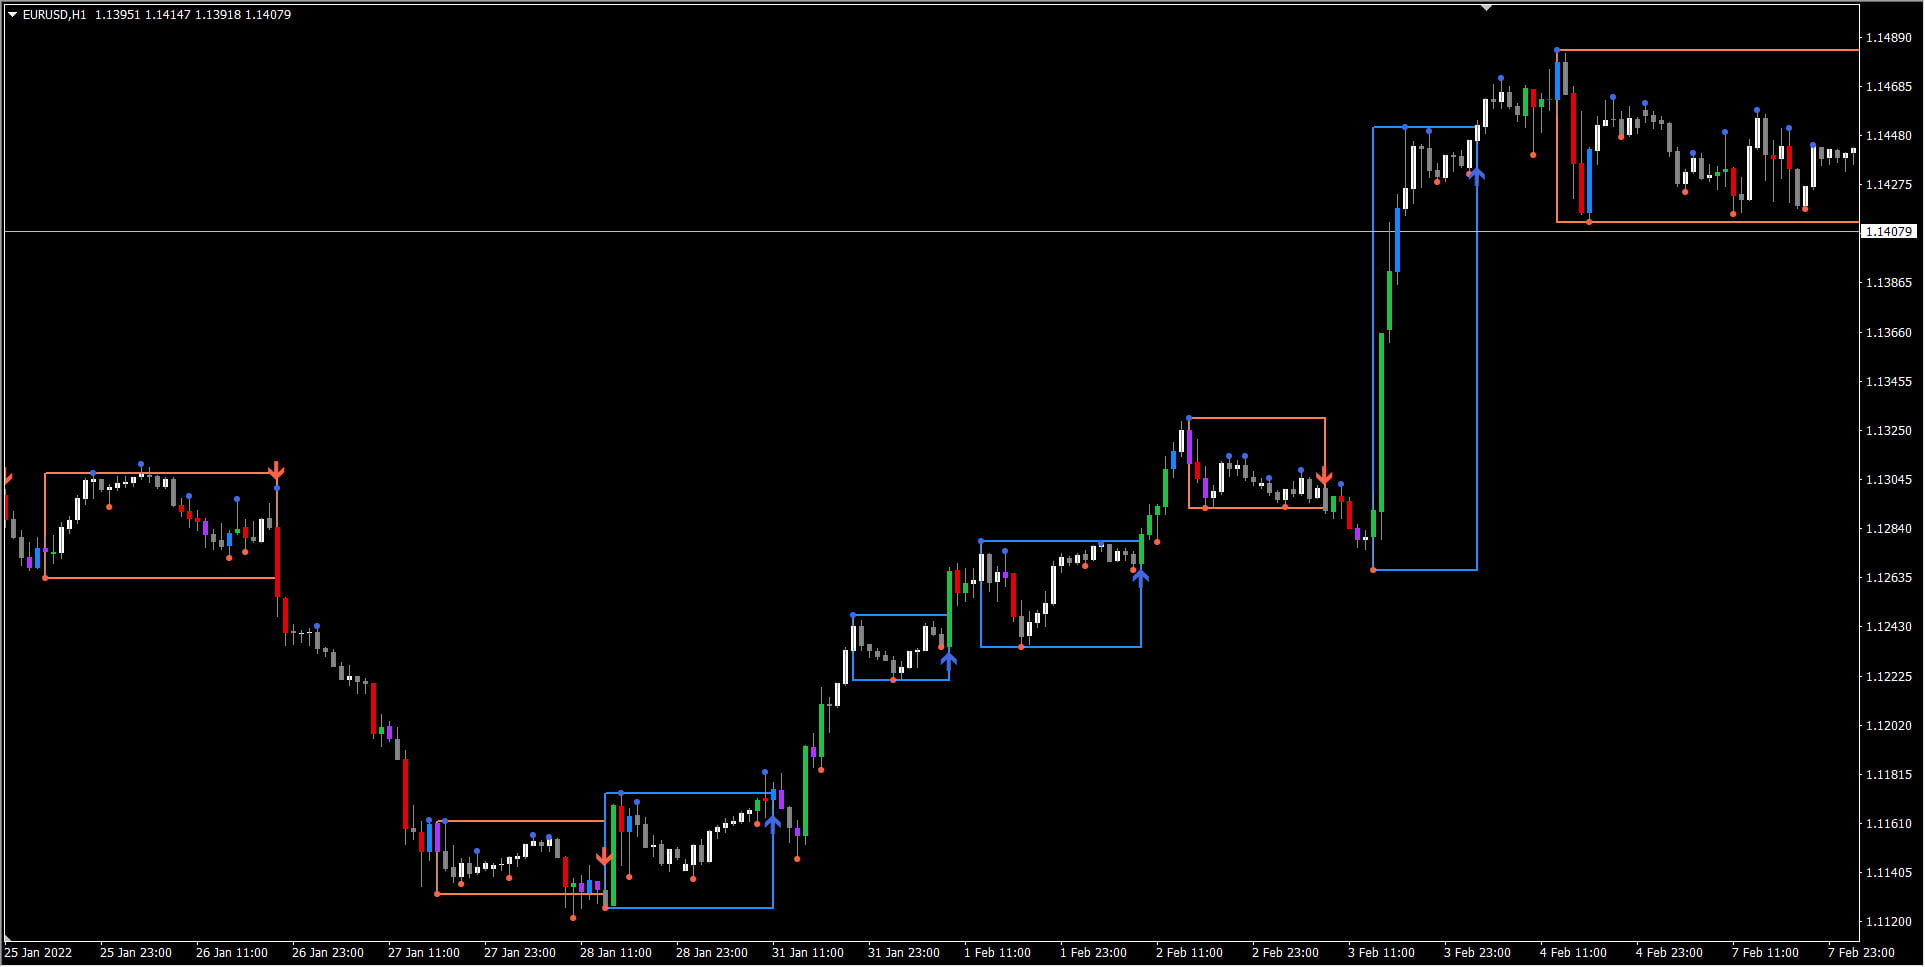
This post will discuss the Darvas Box Indicator. Darvas Boxes can be an increadible tool.
Because they provide great signals showing when price is breaking out of a smaller range. While following the overall trending markets.
If a trend is still going on, and if a trade is already placed, then newer darvas boxes also show a good place to move the stops.
This is based on the Darvas Box indicator available here with a few modifications:
https://forex-station.com/app.php/attach/file/3308077
Please note, I did not create this original indicator. This post is to only explain what each setting means. It will not go into details of code.
Also, post will not talk about the Darvas History.
But if you are interested, here are some great links to tell you about Nicolas Darvas. And the history of how Darvas Boxes came to be:
https://www.investopedia.com/articles/trading/07/darvas-box.asp
https://www.investopedia.com/terms/d/darvasboxtheory.asp
Original Darvas Strategy:
Darvas Box Rules
- A stock is making a new high/low (usually past 52 week high/low)
- After the high is set, there are three consecutive days that do not exceed the high
- The new high becomes the top of the box and the breakout point leading to the new high becomes the low of the box
- Buy the break of the box once it exceeds the high by a few points
- Sell the low of the box if it is breached
- Add to your position as it moves into each new box
Detailed study of original theory:
https://www.definedge.com/darvas-box-theory/
The above indicator uses this strategy as a basis and provides the following:
Current Darvas Indicator Strategy:
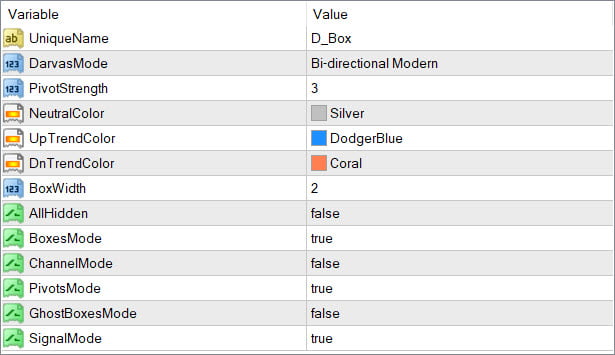
Pivot Strength is default 3 days like in original strategy. To check 3 consecutive days.
Darvas Modes:
- Classic (by Upper Pivot only)
- Modern (by Upper Pivot only)
- Bi-directional Classic (UpTrend by Upper Pivot, DownTrend by Lower Pivot)
- Bi-directional Modern (UpTrend by Upper Pivot, DownTrend by Lower Pivot)
- Classic by 1st Pivot (Upper or Lower based on which Pivot was first)
- Modern by 1st Pivot (Upper or Lower based on which Pivot was first)
Difference between Classic/Modern:
For all Classic modes, the indicator uses Price High and Low for Calculation. And for Modern modes, it uses the Closing prices.
Pivot Strength:
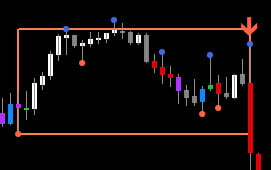
It will look for these number of past bars for High/Low Pivot Points. Blue dot is for High Pivot and Red dot is for low Pivot:
Channel Mode: Show/Hide Darvas channels


