Murrey Lines Explained

Murrey Lines:
In forex, prices really range 70-80 percent of the time. So it is more common for price to be in a range than in a trend.
It is more like, price is moving in a overall trend, while creating smaller ranges in between.
And Murrey Lines are an excellent tool to find areas where these ranges occur.
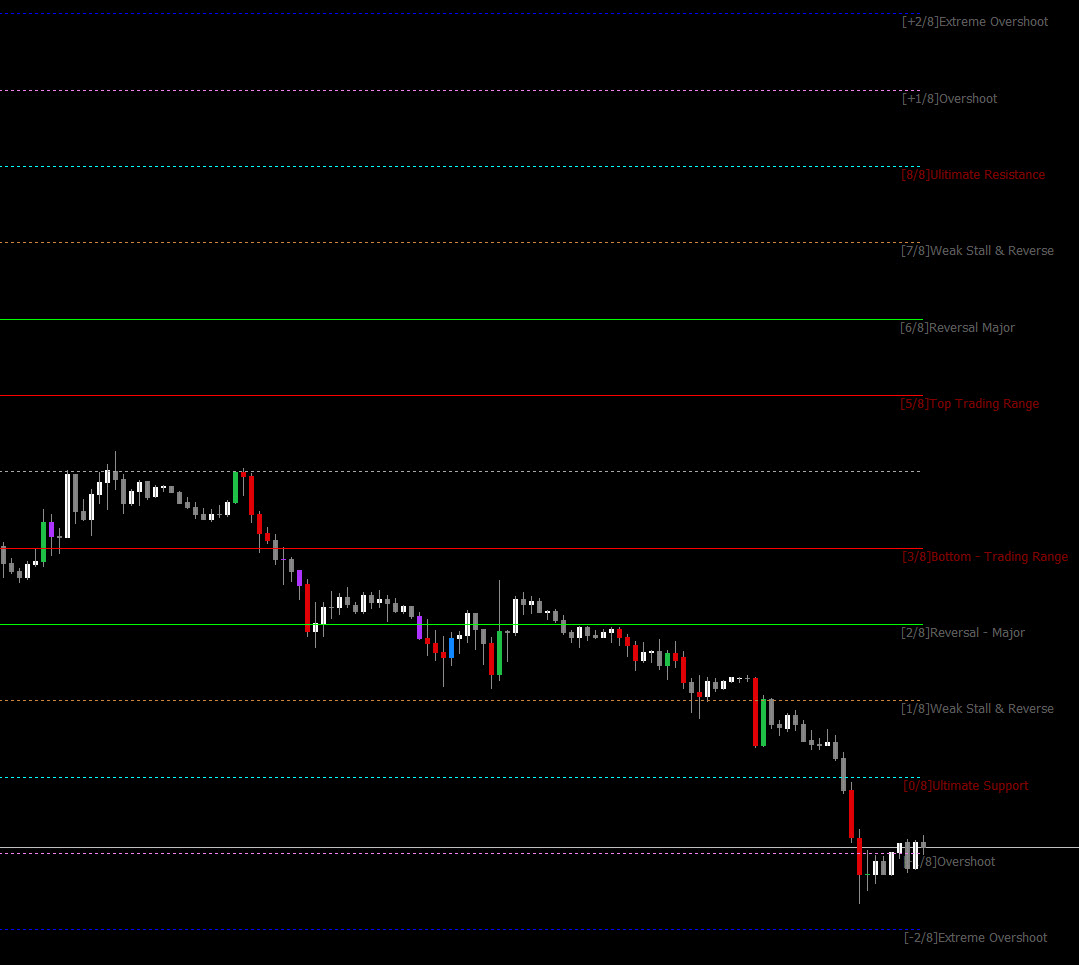
They provide strong support/resistance areas. And the extreme lines towards the ends are strong Overbought/Oversold areas:
This scalper here uses this concept to find best reversal areas:
Download:
This indicator is for drawing Murrey Lines and it also shows the historic murrey lines. So they are easier to study:
There are mainly 9 Murrey lines and 8 intervals.
But this indicator gives us 12 levels to also have extreme Overbought/Oversold levels:
+2(Extreme Overshoot OB)
+1(Overshoot OB)
8(Resistance)
7(Weak Reverse OB)
6(Major Reverse OB)
5(Trading Range Top)
4(Major Pivot)
3(Trading Range Bottom)
2(Major Reverse OS)
1(Weak Reverse OS)
0(Support)
-1(Overshoot OS)
-2(Extreme Overshoot OS)
Murrey Lines Calculation:
It, firstly, calculates the highest high and lowest low points in a given period. Adding Step back bar to the period.
The difference between the high and low is called Range. And from this it calculates SR (Scale Rhythm). And based on this a fractal value is calculated.
Read detailed calculations in document here:
Murrey Levels:
Overshoot and Extreme Overshoot levels are extreme Overbought/Oversold levels.
And the reversal probability of more extreme levels is highest.
8/8 th’s and 0/8 th’s Lines (Ultimate Resistance)
These lines are the hardest to penetrate on the way up, and give the greatest
support on the way down. (Prices may never make it through these lines).
7/8 th’s Line (Weak, Stall and Reverse)
This line is weak. If prices run up too far too fast, and if they stall at this line they will
reverse down fast. If prices do not stall at this line they will move up to the 8/8 th’s
line.
6/8 th’s and 2/8 th’s Lines (Pivot, Reverse)
These two lines are second only to the 4/8 th’s line in their ability to force prices to
reverse. This is true whether prices are moving up or down.
5/8 th’s Line (Top of Trading Range)
The prices of all entities will spend 40% of the time moving between the 5/8 th’s and
3/8 th’s lines. If prices move above the 5/8 th’s line and stay above it for 10 to 12
days, the entity is said to be selling at a premium to what one wants to pay for it and
prices will tend to stay above this line in the “premium area”. If, however, prices fall
below the 5/8 th’s line then they will tend to fall further looking for support at a lower
level.
4/8 th’s Line (Major Support/Resistance)
This line provides the greatest amount of support and resistance. This line has the
greatest support when prices are above it and the greatest resistance when prices
are below it. This price level is the best level to sell and buy against.
3/8 th’s Line (Bottom of Trading Range)
If prices are below this line and moving upwards, this line is difficult to penetrate. If
prices penetrate above this line and stay above this line for 10 to 12 days then prices
will stay above this line and spend 40% of the time moving between this line and the
5/8 th’s line.
1/8 th Line (Weak, Stall and Reverse)
This line is weak. If prices run down too far too fast, and if they stall at this line they
will reverse up fast. If prices do not stall at this line they will move down to the 0/8
th’s line.