NRTR Explained
NRTR is an amazing Indicator for finding price Trends. And for getting good areas for placing stops.
NRTR Download:
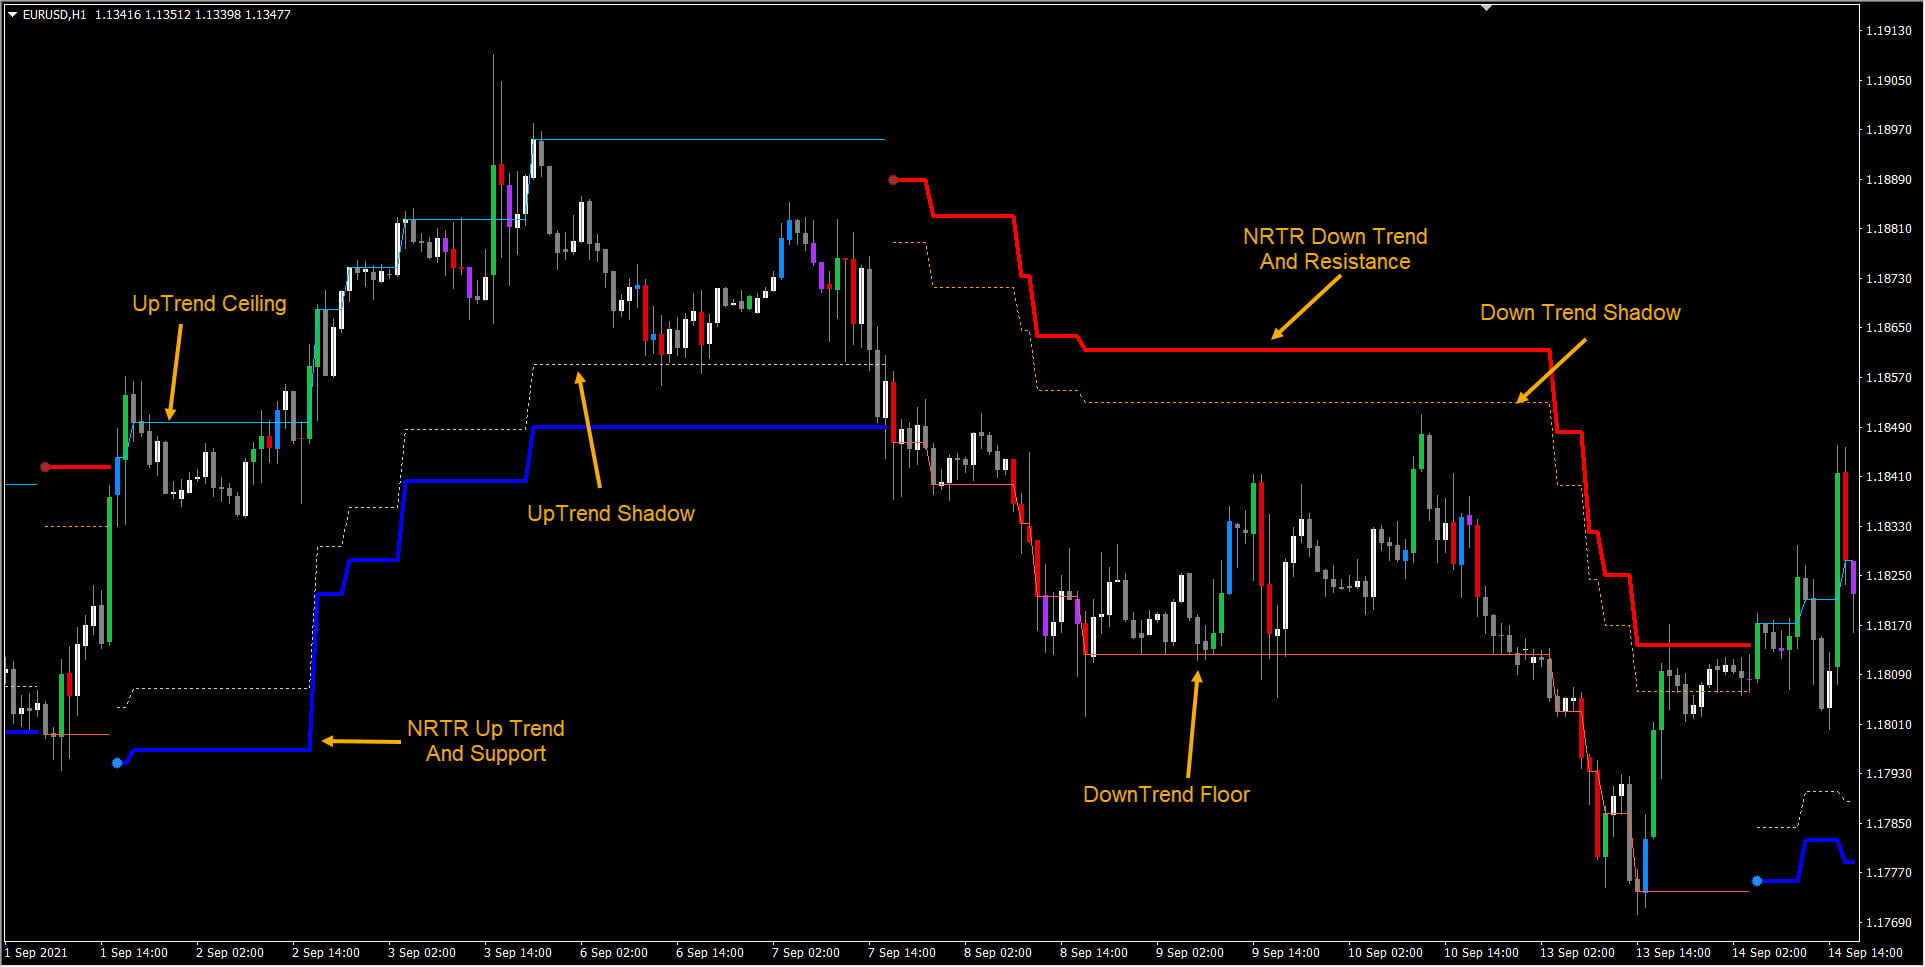
NRTR Components:
- Up Trend (Thick Blue Support Line)
- Down Trend (Thick Red Resistance Line)
- Up Trend Ceiling (Thin Blue Line)
- Down Trend Floor (Thin Red Line)
- Up Trend Shadow (Dotted Blue Line)
- Down Trend Shadow (Dotted Red Line)
Calculations:
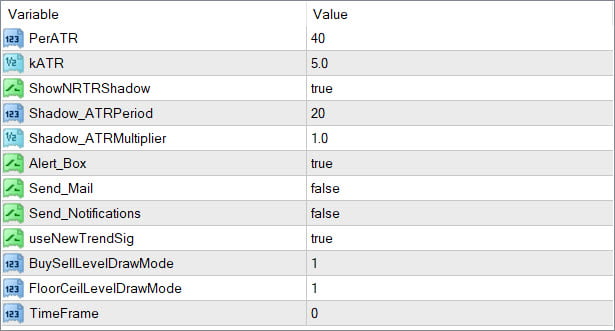
- PerATR: It uses this as ATR Period
- kATR: ATR Multiplier
Using these 2 variables it calculates the distance. And based on ongoing trend, it draws the Support (Blue) or Resistance (Red) lines.
For Up Trend only Support and for DownTrend only Resistance drawn.
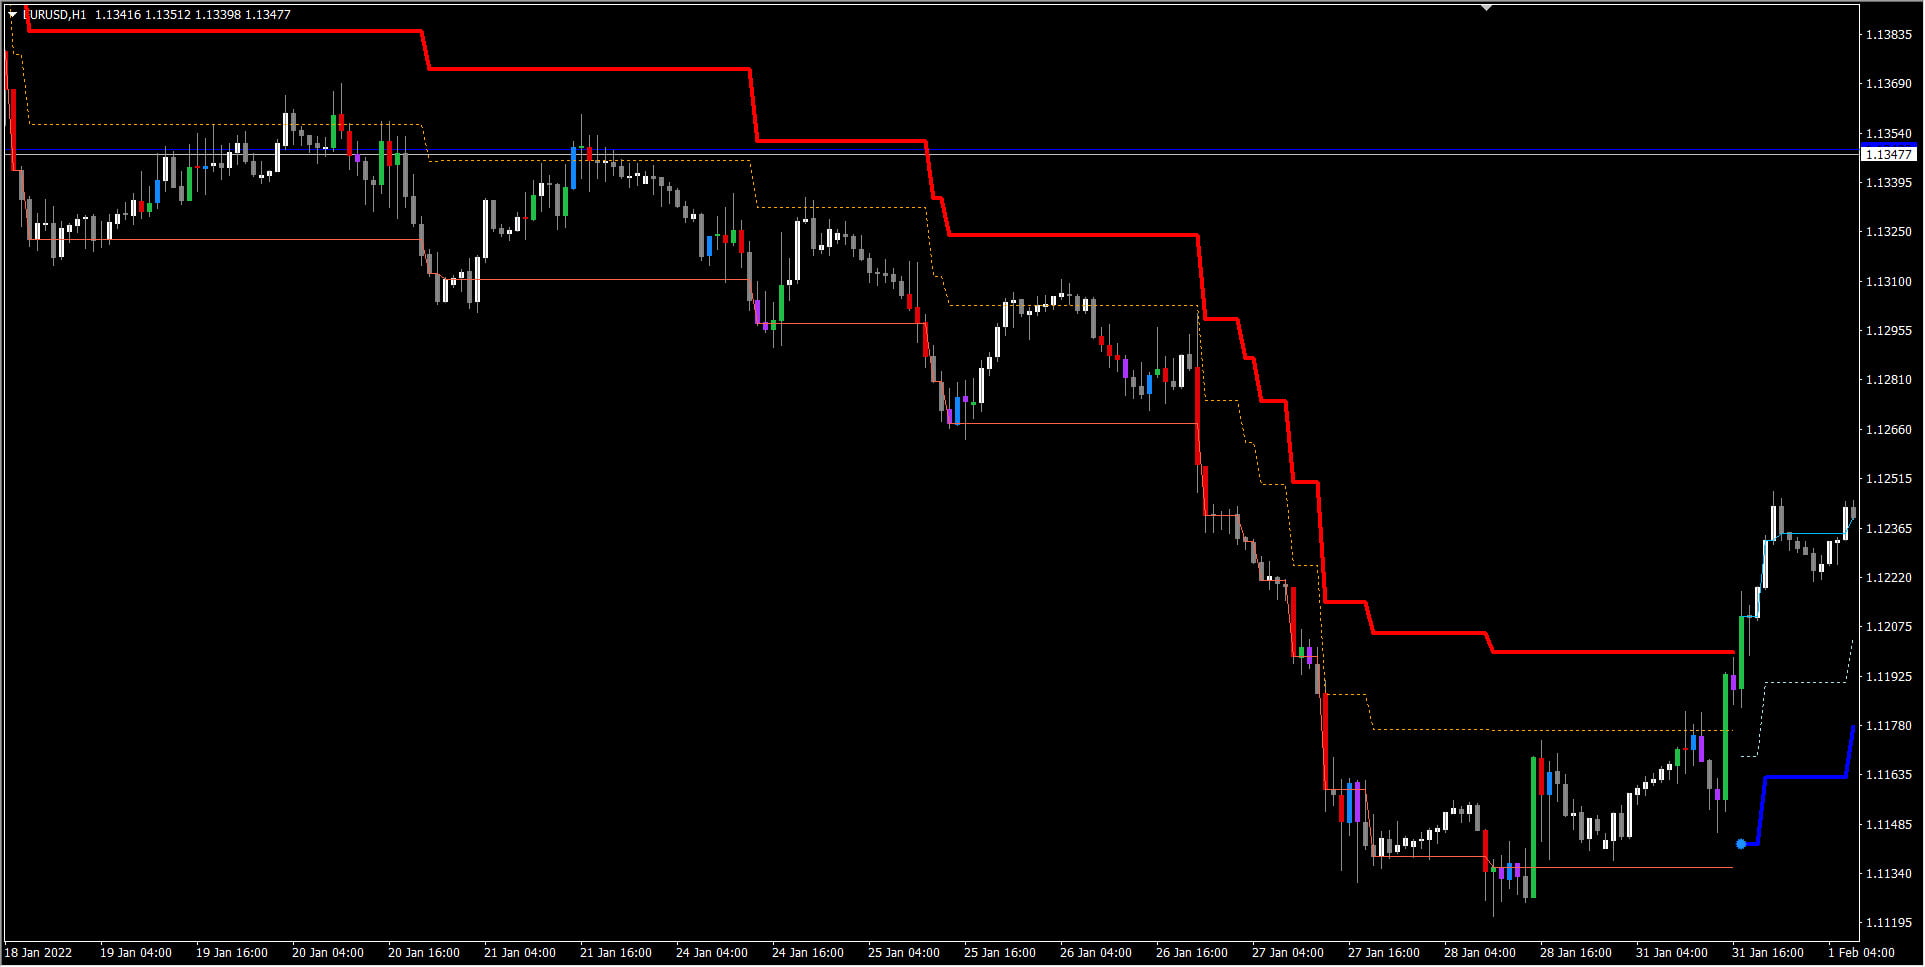
E.g.: For Up Trend, if price keeps going Up, it will keep drawing the Ceiling (Thin Blue line) as price keeps breaking previous Highs upwards.
And if price retraces, and breaks the lower Support, the it will switch to Down Trend and calculate Resistance using PerATR and kATR.
Once again, price will keep going down making new lows and it will keep drawing the Floor (Red thin line). And wait for price to retrace and break the Upper Resistance again. And so on…
The SR is even Stronger when near a strong Pivot or a Fibo level:
Shadow:
This is the dotted line which follows the Resistance or Support lines. This is also calculated using ATR:
- Shadow ATR Period
- Shadow ATR Multiplier
To have a bigger shadow increase the multiplier.
This is useful because price sometimes enters the shadow, but doesn’t break the Support/Resistance. But instead bounces off the shadow and continues the trend.
Which means that the SR area held strong, and we can trade in direction of the ongoing trend.
