Extreme TMA Scanner and Arrows Indicator – Extras
This post contains the extra Metatrader 4 indicators for mql5.com Market product:
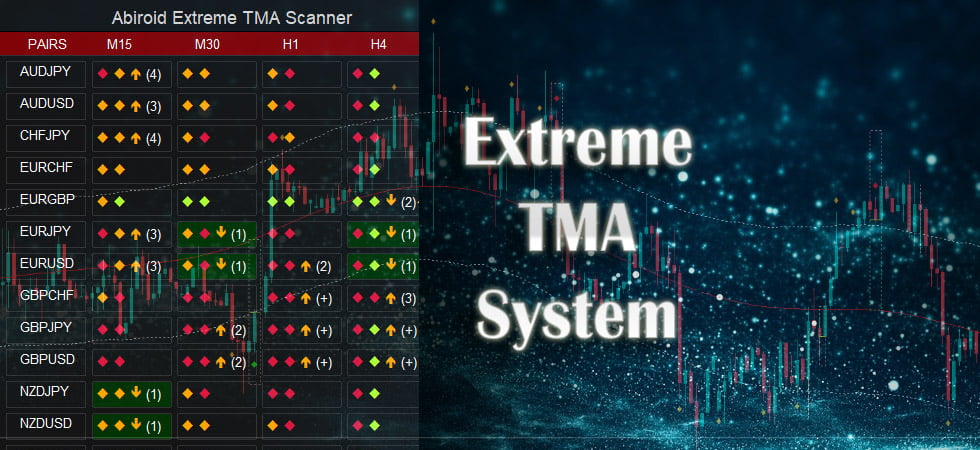
Extreme TMA System Scanner Dashboard:
https://www.mql5.com/en/market/product/44825
and
Extreme TMA System Arrows Indicator:
https://www.mql5.com/en/market/product/44822
Additional indicators/template:
To use Abiroid_Scanner_Extreme_TMA.tpl file, in Dashboard properties: “Use Template For New Window”: Abiroid_Scanner_Extreme_TMA
Extreme TMA System
Arrows Indicator:
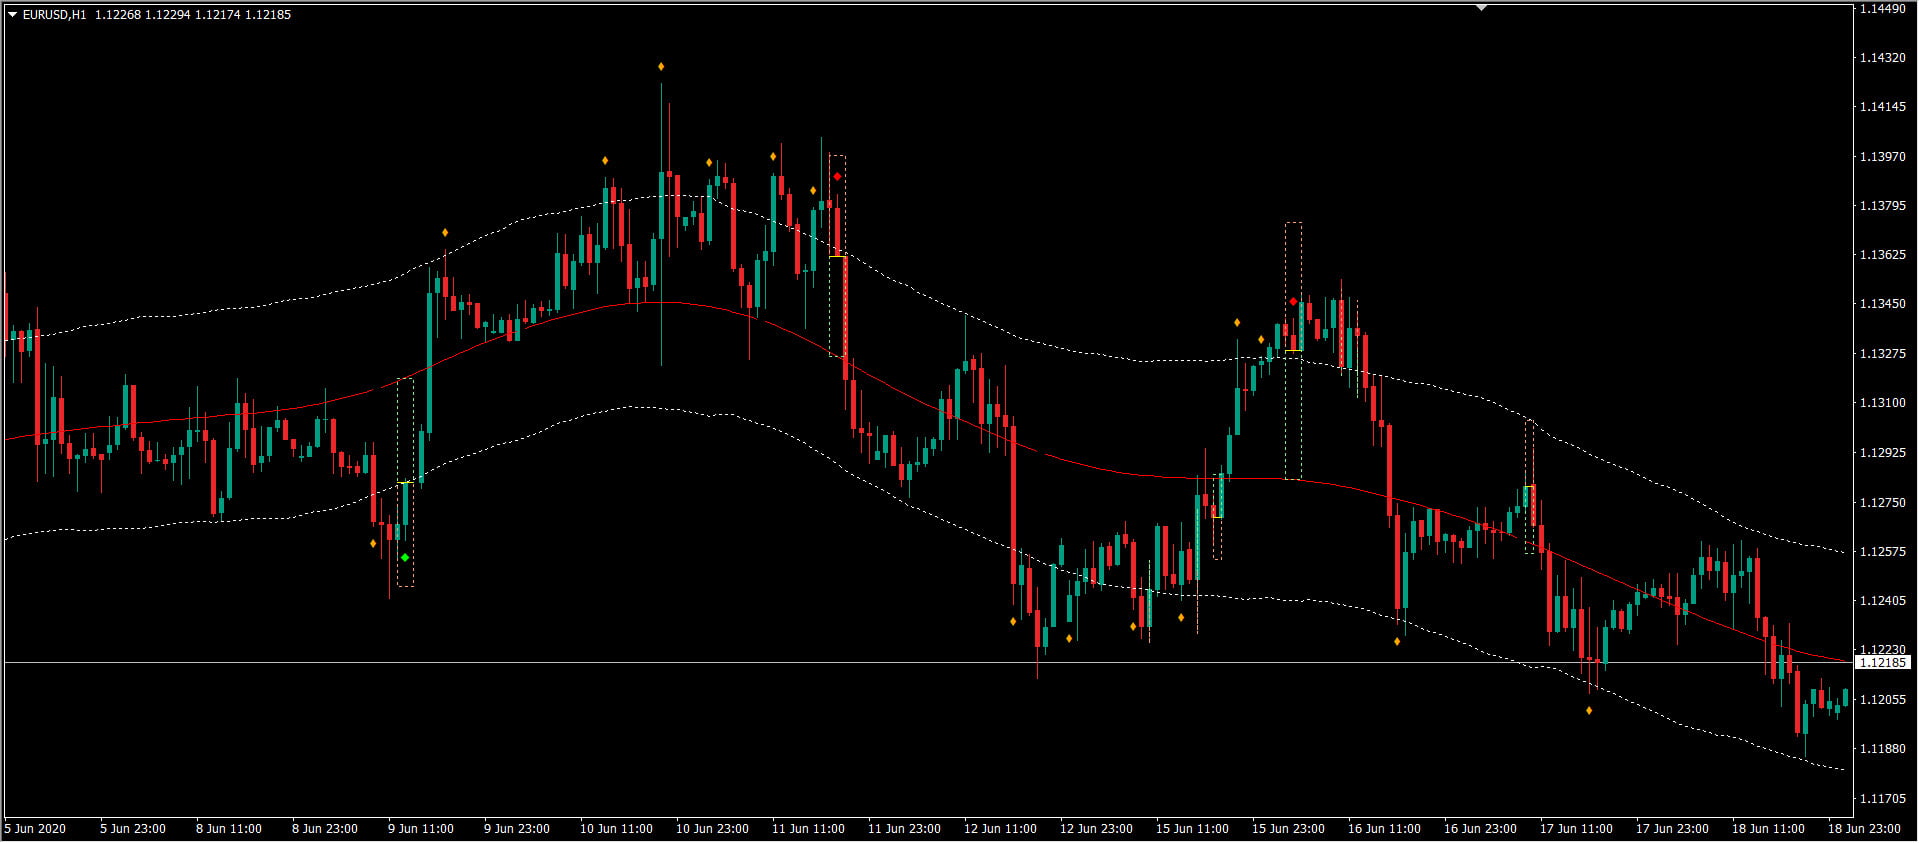
This indicator shows BUY/SELL Signal Arrows and also shows most probable Take Profit. And Stop Loss is calculated based on ratio you set for StopLoss:TakeProfit.
There are 3 TMA Bands: Upper, Middle and Lower bands.
When price crosses Upper band, it will reverse and give a SELL Opportunity and if it crosses Lower bands, there is a BUY Opportunity.
Once reversal happens price will go at least up to the middle band.
To verify this reversal, we have to check 3 things:
1. TMA Slope (of current and Higher timeframes)
2. Support/Resistance Lines
3. RSI OverBought/Sold
About Support/Resistance:
If price is close to Support and it crosses the lower band also, it will likely reverse for BUY.
If price is close to Resistance and it crosses the upper band, it will likely reverse for SELL.
Check out the video tutorial for both indicators here:
Scanner Dashboard Indicator:
This Scanner Dashboard uses the Extreme TMA System Arrows Indicator to show good BUY/SELL signals.
Dash shows Slopes for current and Higher Timeframes.
- First diamond is current TF. Next diamonds are higher TF. You can select how many higher TF you would like to have.
(Please Note: Slope Calculation uses ATR and TMA for several past bars. So, having too many slopes for many pairs and timeframes might make dashboard slow.
e.g: Having 4 slopes for 28 pairs for 4 TFs will make dashboard load in about 30-40 seconds depending on your PC.)
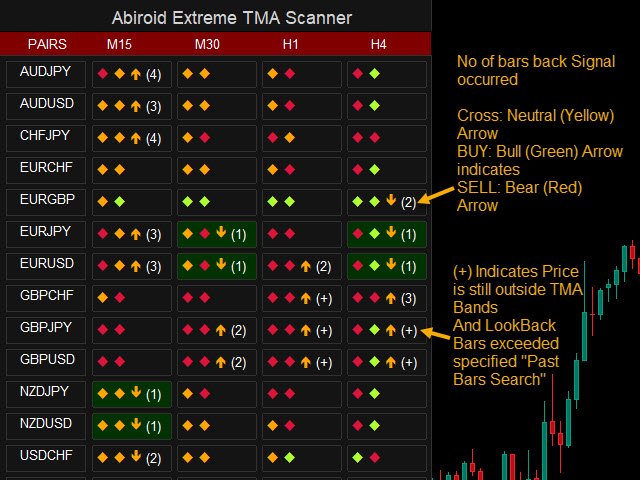
- Last Arrow is TMA Signal:
Yellow arrow: price Crossed band up or down
Red/Green arrow: price started coming back inside TMA bands.
- Bracket number shows number of bars back where TMA Signal happened.
BG Dark Green: price below lower band and soon ready to go up.
BG Dark Red: price above upper band and soon ready to go down.
When BUY/SELL signal occurs, block turns Green/Red.
Dashboard Specific Settings:
- Main Pairs Preset: Contains Own Pair List or Presets like Core 7, Core 14, All 28 pairs etc.
- OwnPairs: Comma Separated list of your own custom pairs or other stocks supported by your Broker. e.g: EURUSD,EURGBP,BTCUSD
- TimeFrames: Comma Separated List of Timeframes
- fontSize: Size of Dashboard font. Keep between 6 and 8. Keep 6 if you have too many pairs and want dash to be smaller. Below 6 font appears too small.
- ColumnsNum: Number of columns of dashboard. Helps make dashboard height a bit smaller to fit more pairs.
- x_axis, y_axis: Position of your dash
- OnButtonClick Open New Window: If true on clicking any Timeframe/Pair button – open that chart in a new window
- Use Template For New Window: Apply template to chart opening in new window. Won’t be applied if previous property is false
- Prefix: Set a prefix if you will use multiple dashboards on same chart
- Alerts: Popup, Sound, Email, Notification – set true/false
- Past Bars Search For TMA Signal: Number of past bars to search for TMA Cross or TMA Up/Down Signal and show number in brackets
Common Arrows/Dashboard Settings:
- seeDetailedJournalLogs = true (Get Detailed Logs in Journals Tab)
- TMA Bands Options: FastLineTMA (Repaints), TMATrue (non-repainting), TMA+CG (repaints)
- Slopes Options: Slope1 (Repaints) and Slope2 (non-repainting)
- TMA_Period = 50 (Triangular Moving Average Period)
- ATR_Period = 100 (ATR Period)
- ATR Multiplier (To move channels closer or further)
- checkHTFSlope = false (Check Slopes for next 3 Higher TF)
- checkCurrentTFSlope = true (Check slope for Current TF)
- ignoreMNSlope = true (Ignore Monthly slope or not)
- TMA_SlopeThreshold = 0.3 (Slope Threshold for Checking Bullish/Bearish)
- useRSI = false (If Use RSI true – only trade BUY if RSI OverSold and SELL if RSI OverBought)
- RSI_Period = 14
- RSI_OversoldLevel = 30
- RSI_OverboughtLevel = 70
- ignoreTooCloseMiddleBand = true (TakeProfit will be somewhere close to Middle Band. But if price already reached too close to middle band then ignore signal or not)
- minDistFromMiddleBand = 0.3 (0.3 means 30% distance from Middle Band. If ignoreTooCloseMiddleBand true and price reaches more than 30% distance from middle band then ignore signal)
BUY SELL:
– If useHeikenAshiPrice is true – use Heiken prices
- If Price has crossed Upper/Lower bands
- If useRSI is true and Price OverBought/OverSold
- If checkCurrentTFSlope or checkHTFSlope – do a Slope Check as described in next section
- If “Ignore If TakeProfit Too Close” is true – and price less than “Min Distance from TakeProfit” percentage.
If all conditions match, you will get a BUY or SELL Signal and Alert. BUY is Green Background. SELL is Red background.
Slope Check:
SlopeThreshold is 0.3.
- Slope < -0.3 means Bearish. Show only SELL Signals.
- Slope > 0.3 means Bullish. Show only BUY Signals.
- Slope between -0.3 and 0.3 means Market is Ranging. Show both BUY and SELL Signals
Take Profit Distance Calculation:
- MinDistance is 0.3 means 30%
- 100% distance is between Upper/Lower band and Middle band.
- Distance between Upper/Lower band and starting price is already more than 30% then ignore the signal.
Hi today I purchased the Ichimoko system along with the TMA system. When setting up the TMA system, the template I dopwnloaded doesnt seem to have the indicators in the extras package.. also the template doesnt have the buy/sell arrows.. please help, maybe send me a new template that works with the latest extras package and the scanner.. Thanks and look forward to your reply.
Hi Tony,
Hope template is working well now.
I know the problem was solved, but just for reference for others 🙂
Copy everything in extras folder as is inside MQL4 directory.
The template will look for indicators inside folder structure:
MQL4/Indicators/Abiroid_Extreme_TMA/
It’s just for keeping all indicators more organized, and to prevent overwriting any existing indicators.