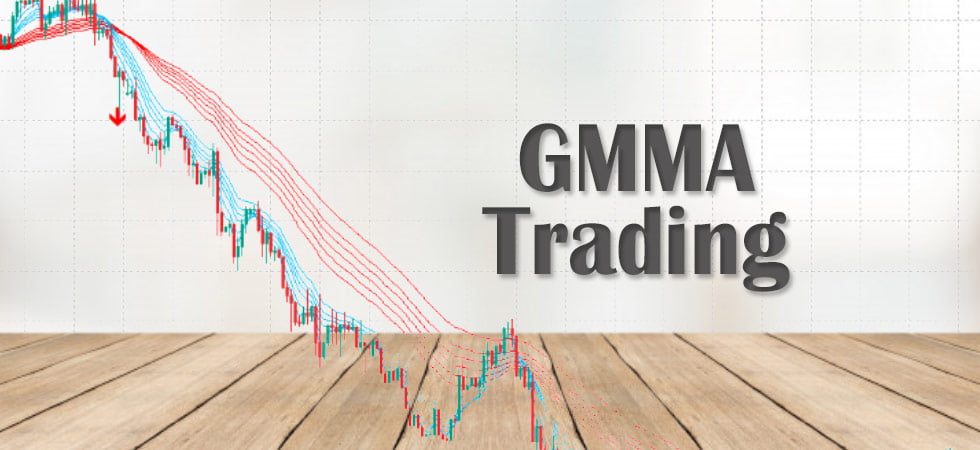
GMMA: Guppy Arrows Indicator
This indicator uses the Guppy Multiple Moving Average Trading method to alert you of a possible coming trend.
What is a ‘Guppy Multiple Moving Average (GMMA)’?
GMMA attempts to identify trends by combining two groups of moving averages with differing time periods:
The long-term EMAs (30, 35, 40, 45, 50, and 60) the behaviors of investors that have taken a long-term approach to a given market. The short-term EMAs represent traders (3, 5, 8, 10, 12, and 18) who are attempting to capture short-term profits.
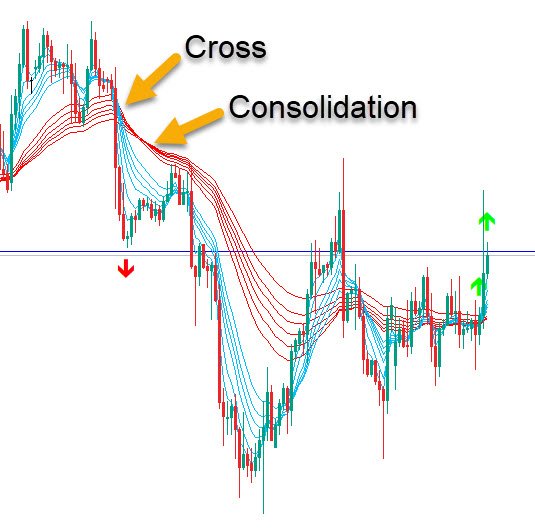
As you can see in the diagram below, blue lines are the short-term EMAs and red lines are long-term. With this system, you would buy when all of the short-term EMAs cross above all of the long-term EMAs, and sell when the short term EMAs cross below the long-term EMAs.
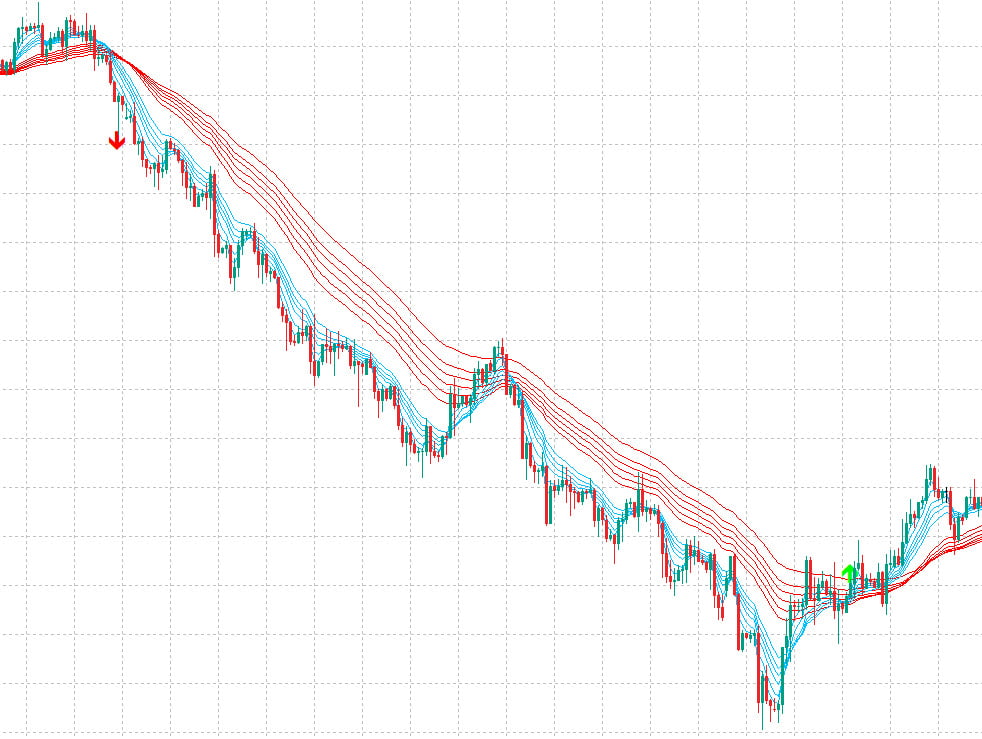
If both groups become compressed with each other, or crisscross, it indicates the price has paused and a price trend reversal is possible. Usually the short-term lines cross the long-term ones and then the long-term ones consolidate and get closer. Meaning change in trend is coming next. After the consolidation sometimes price pulls back towards the long-term EMAs and then goes in the new trend direction. So basically, after cross wait for consolidation and then wait for a possible swing back and then when you are sure a new trend is starting, then start a trade. This indicator shows arrows in the next bar, right after all short-term EMAs cross the long-term ones.
It works only in trending markets. In ranging markets, EMAs will criss-cross often and have no real trend. So, only trade it when trade volumes are high enough.
Also use this with Support/Resistance and TDI indicator to show you the best time to place a trade. All these additional indicators are in the download below:
Download:

[…] https://abiroid.com/indicators/guppy-arrows-indicator […]