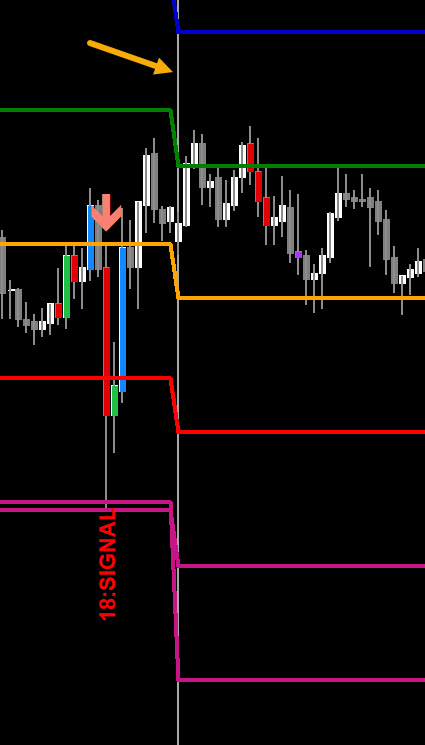
Abiroid Golden MA Scalper
0 $
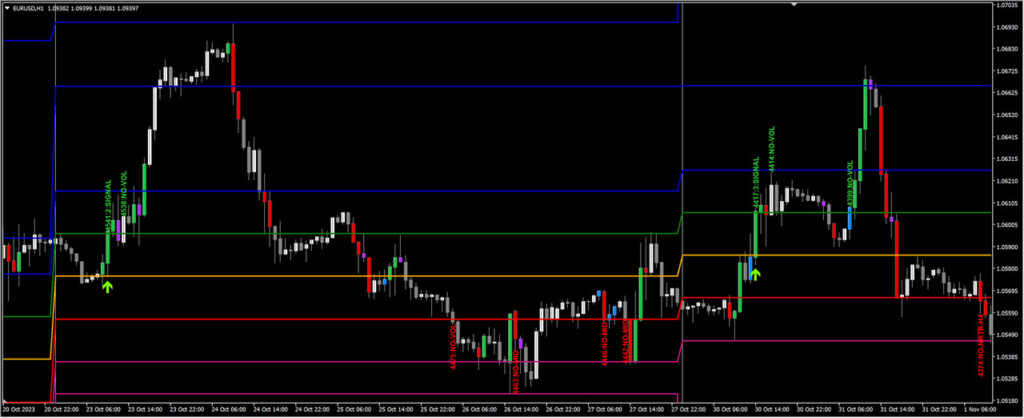
Get from MQL5- OB/OS Levels from Golden MA Levels
- Wait for Buy/Sell Start Level Cross
- Optional: Mid Level Cross Check
- Optional: High/Medium Volume Check
- Optional: MA Stack Check
- Optional: NRTR HTF Check
All products are non-refundable. Since these are digital products. No source code available, only executables. Please read product description carefully before buying.
Original forum post is here requested by Araknobug:
https://abiroid.com/ideas/mt4-indicators/golden-ma-mtf-tt-strategy/
Similar to logic used in: Golden MA MTF TT
Levels with Buffers available here:
Golden MA Levels Indicator:
https://www.mql5.com/en/market/product/119515
Note: Arrows/Scanner don’t need this indicator on chart to work. They will use it internally. Purchase this only if you need to see Levels on your chart. Or if you need to use Buffer values for your own Indicator/EA etc.
Features:
- Get OB/OS Levels from Golden MA Levels
- Wait for Buy/Sell Start Level Cross
- Optional: Should price cross Mid Level in earlier bars
- Optional: Crossing bar High/Medium Volume
- Optional: MA Stacked to check up/down trend for current TF
- Optional: NRTR higher timeframes aligned Check
Best Trades:
Better to trade with at least M15+. Best timframes will be M30 and H1.
Default settings are for H1. For lower timeframes, you can change the Start Pips to lower.
Based on line distances you need.
And trade pairs like Forex core-7 or 14 which will have good swings. During good volatility market times when their corresponding market is open.
Be Careful:
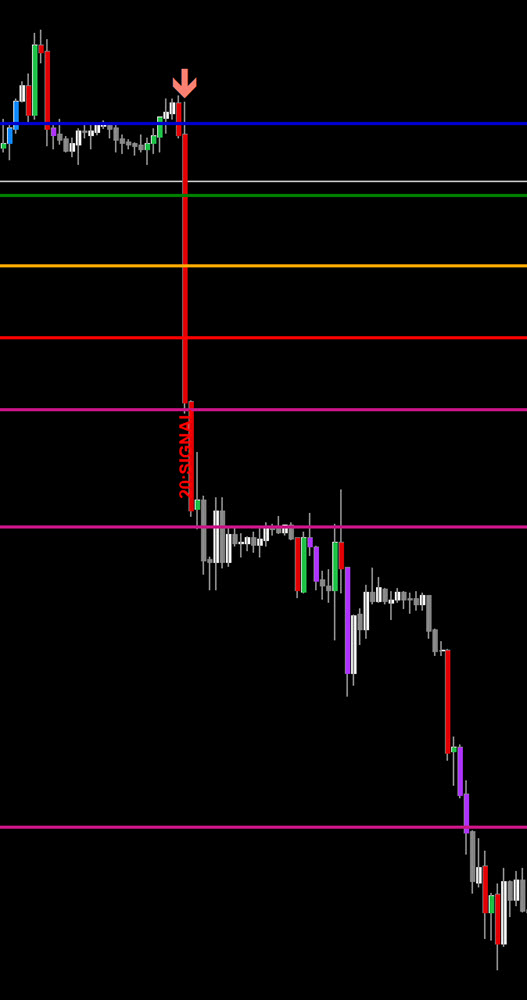
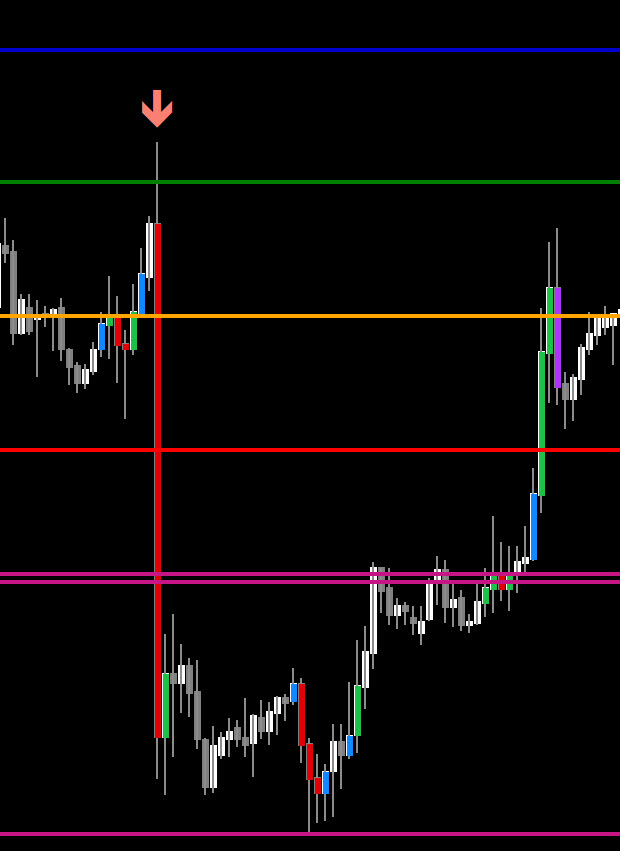
Suppose breakout bar has already crossed too far, and has reached beyond Buy/Sell stop levels, then avoid signal.
Price in a lot of cases might continue with the trend:
But that won’t always happen. So be careful:
Keep close stop losses. So that even when trade doesn’t go your way, the loss would not be much. And TP can be 1.5 to 2 times SL.
Suppose, you are using daily, then the vertical grey lines will show Day. If you are using Weekly HTF, then grey line will show end of week etc.
Don’t Trade:
Avoid low volatility markets, or whipsawing, uneven or choppy markets. Or during news events when price can rise and fall crossing many levels in a single bar. This strategy is best for swing markets. So will not give good trades when market is in a low volatility tight range.
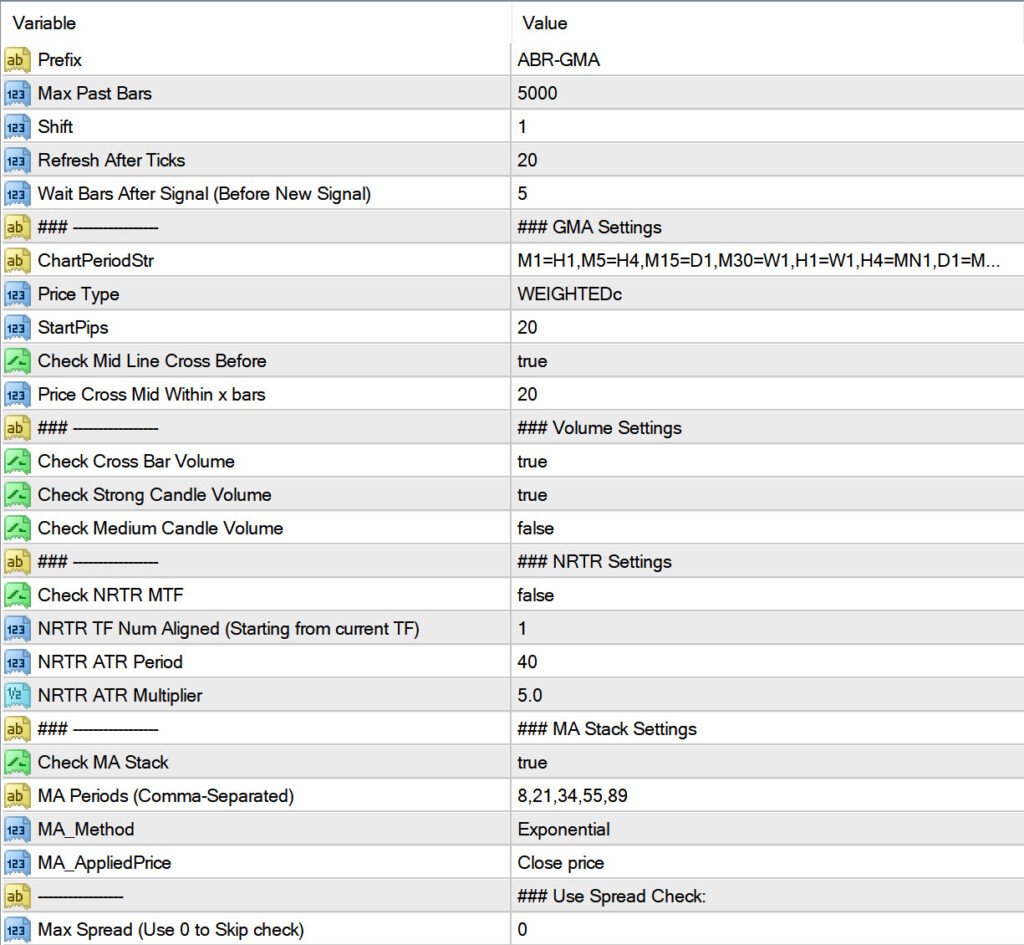
Settings:
Candle Settings:
Prefix: Used to draw debug messages on chart
Max Past Bars: Max number of bars to scan for signals
Shift: Starting bar
Refresh After Ticks: Refresh after these given number of ticks
Wait Bars After Signal: Once a signal happens, wait at least these number of bars before new signal. This is to prevent multiple same direction signals in case price crosses levels multiple times
GMA Settings:
Chart Period String: You can specify higher timeframe for each current timeframe. It will use the Open/Close/High/Low from that higher TF.
Suppose you have H1=W1 then for H1 timeframe, it will use the previous bar from weekly.
Start Pips: Used for calculations of levels.
Look here for detailed calculations explained:
https://www.mql5.com/en/blogs/post/758392
Check Mid Line Before Cross: Main signal is when price crosses the Buy/Sell Start lines. But signal is even stronger when price is coming all the way from mid line in a strong way. Within a given number of bars. Usually 5-10 bars. And then crosses the start levels. Because if price ranges too much after Mid level and before crossing start levels, then trend isn’t strong enough. For same reason it’s good to check for medium/strong volume bars for candle crossing the start levels. (Next few volume settings)
For quick scalping, you can keep the below trend checks off, as these will limit signals. You can just manually look for overall HTF trend by going to higher charts. And trade signals if trend looks good.
NRTR Current and Higher TF:
It’s good to trade signals in overall trend direction of higher timeframe trend. You can use NRTR for that.
Starting from current TF, you can set how many TFs to check NRTR for. And all should be aligned for a valid signal.
MA Stack:
Same way, using MAs Stacked will show current TF’s overall trend. Higher MAs will mean longer term trend. Lower MAs will mean more recent trend. Use the Abiroid MA Stack to see what MAs look like on chart:
https://www.mql5.com/en/market/product/69539
For BUY Signal, fastest MA should be higher and medium MA in middle and slowest MA stacked at bottom. And vice-versa for SELL.
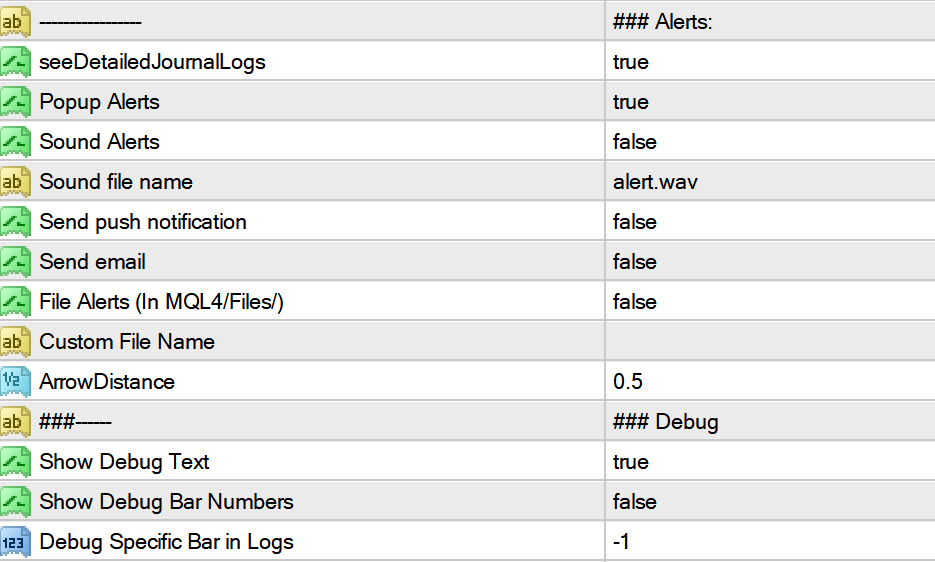
Debug:
Use debug settings when you need to see why a signal is ignored on a particular bar.
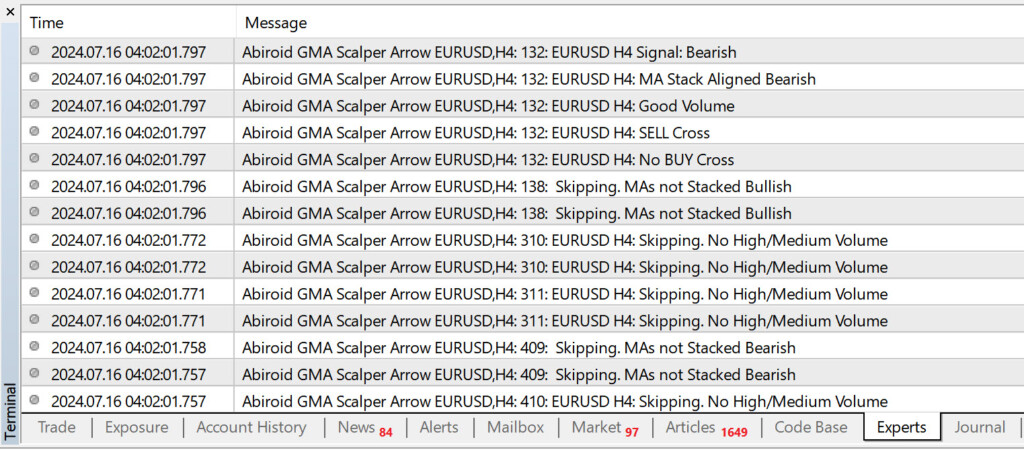
Messages:
You can even set a particular bar number for which you can get debug logs in detail in your Experts tab.
E.g: Here we have 132 bar. So it shows that it first looks for BUY and doesn’t find any Buy start level cross. Then it looks for SELL and finds a level cross. And good volume and MAs Stacked. So it gives a Bearish signal. Not setting a bar number will just show why a bar was skipped.
Troubleshooting:
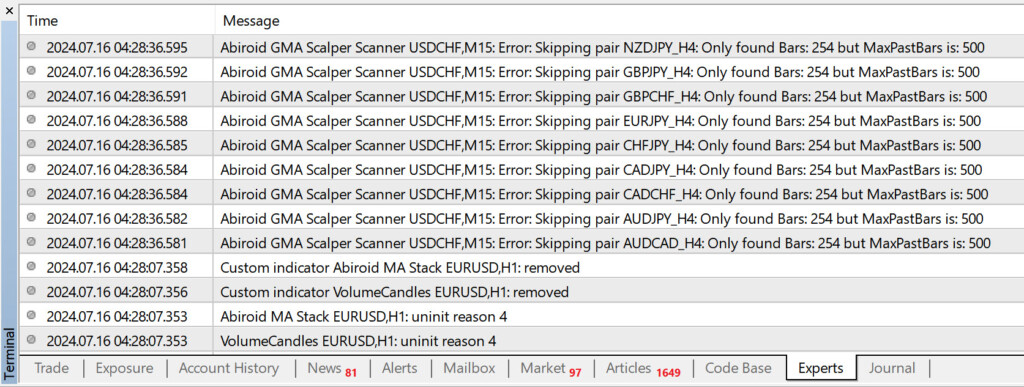
If you have a new MT4 installation and all pairs don’t have bars loaded yet, you might get error:
Error: Skipping pair NZDJPY_H4: Only found Bars: 254 but MaxPastBars is: 500
You can go to History Center and make sure that bars are properly downloaded.
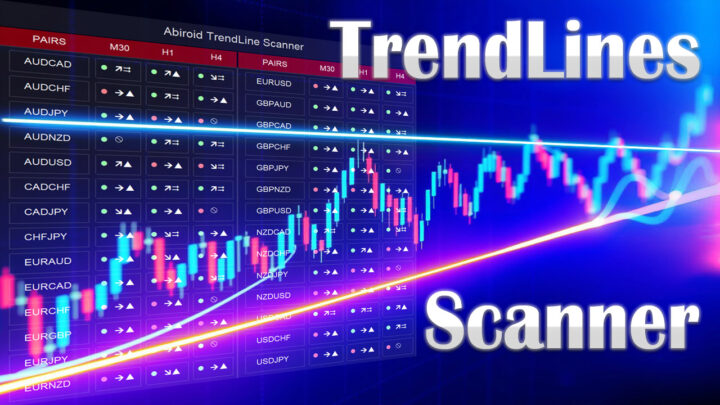
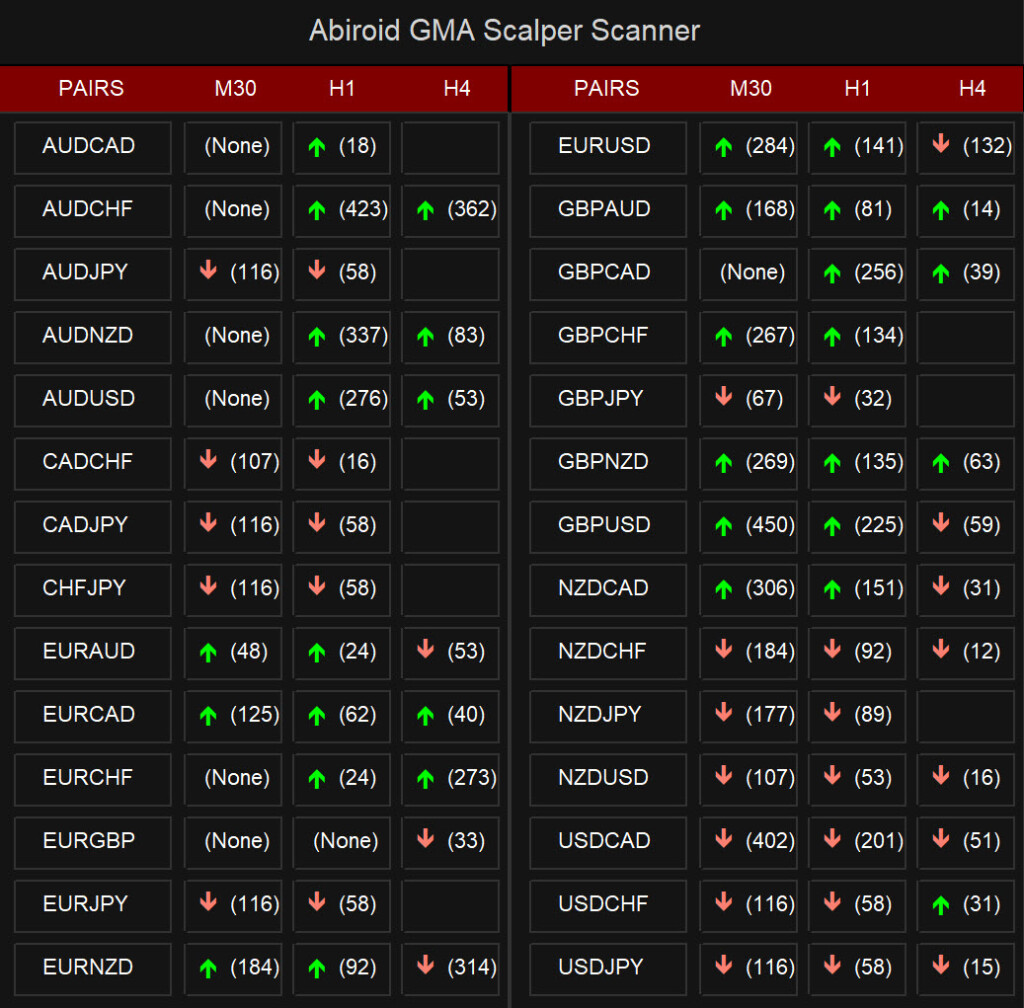
Scanner:
If you enjoy using Arrows version and would like a simplistic scanner, please let me know.
Also, your reviews on mql5 site would help my products reach more people 🙂
Scanner is still under development.
It will only show Arrows and Alerts. And bracket numbers of how many bars back the signal happened:
Since scanner needs the Arrows in same directory, I’m not uploading it as a separate product on mql5.
As it will not work as a standalone. And they have specific rules about an indicator not depending on another ex4.
Changelog:
v1.0 Base version
| mql_site_link |
|---|
Related products
Abiroid Quarters Scanner
Engulfing Candles Price Action
Darvas Box Strategy Arrows and Scanner
- Check Darvas Box Breakout
- Check Price Above/Below MA or Darvas Box has crossed MA
- NRTR Trend Check
- Heiken Trend Check
- MA Slope Check
- Higher Timeframes Price and MA check
- Fixed Stop Loss and Take Profit Option
- Variable Stop Loss at Darvas Box or Darvas Pivots or selected MA
- Calculation of Profit Loss Points and Win/Loss Count and Profit Percentage
Abiroid 3LZZ Simple Semafor Scanner
Abiroid Sway COG
TDI Scanner Dashboard
ProfitPercent Arrows MA Confluence
- Main Signal Indicators (Any One): MA Cross (In-built) or Hull, OBV Cross, Heiken Ashi Cross
- Validation Indicators (Preferably less than 3): OBV (with Min Distance), Heiken Ashi, ADX, SuperTrend, PSAR, Higher TimeFrame EMA Alignment
- If MA Cross and OBV Cross both are false, only then Heiken Cross will be taken as Main Signal.

