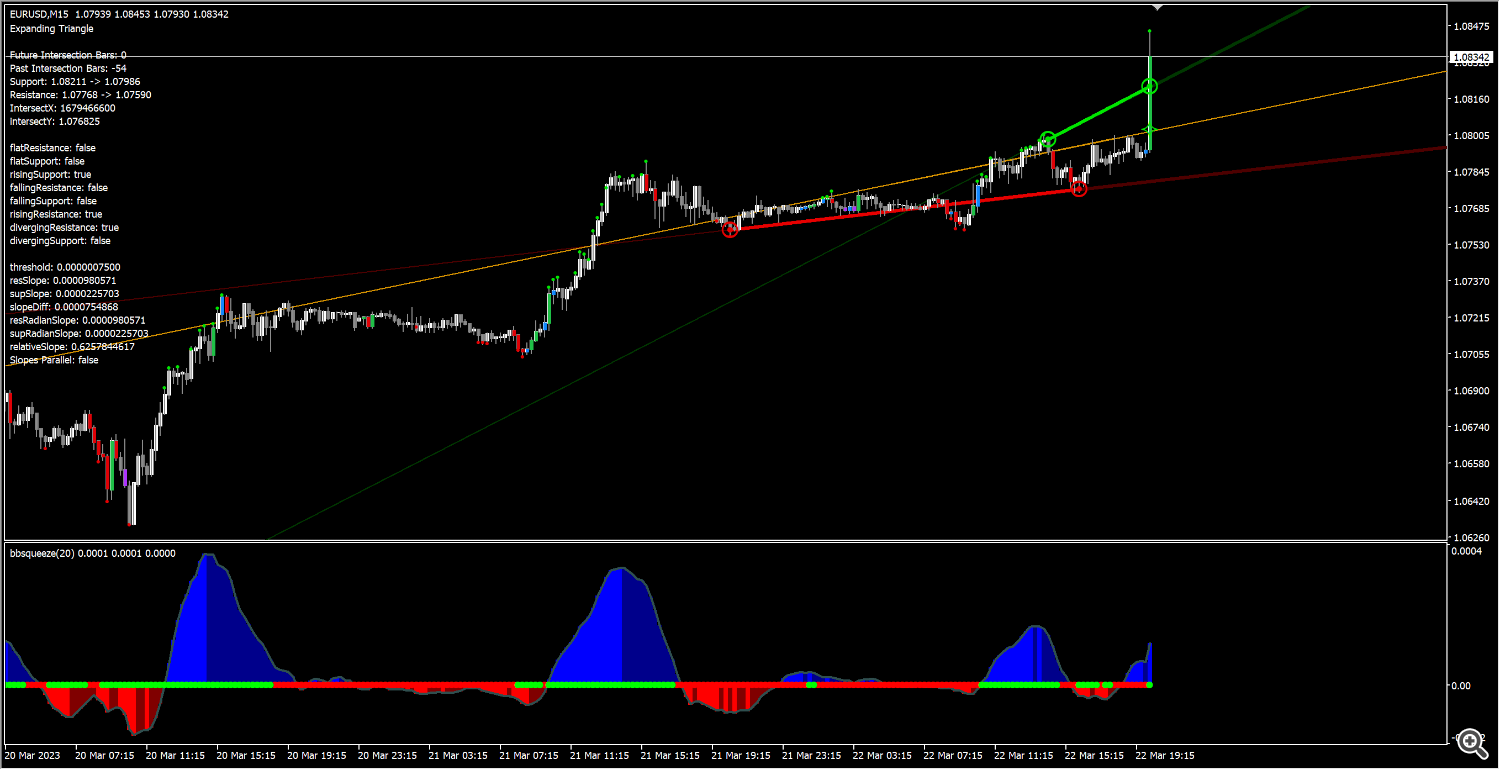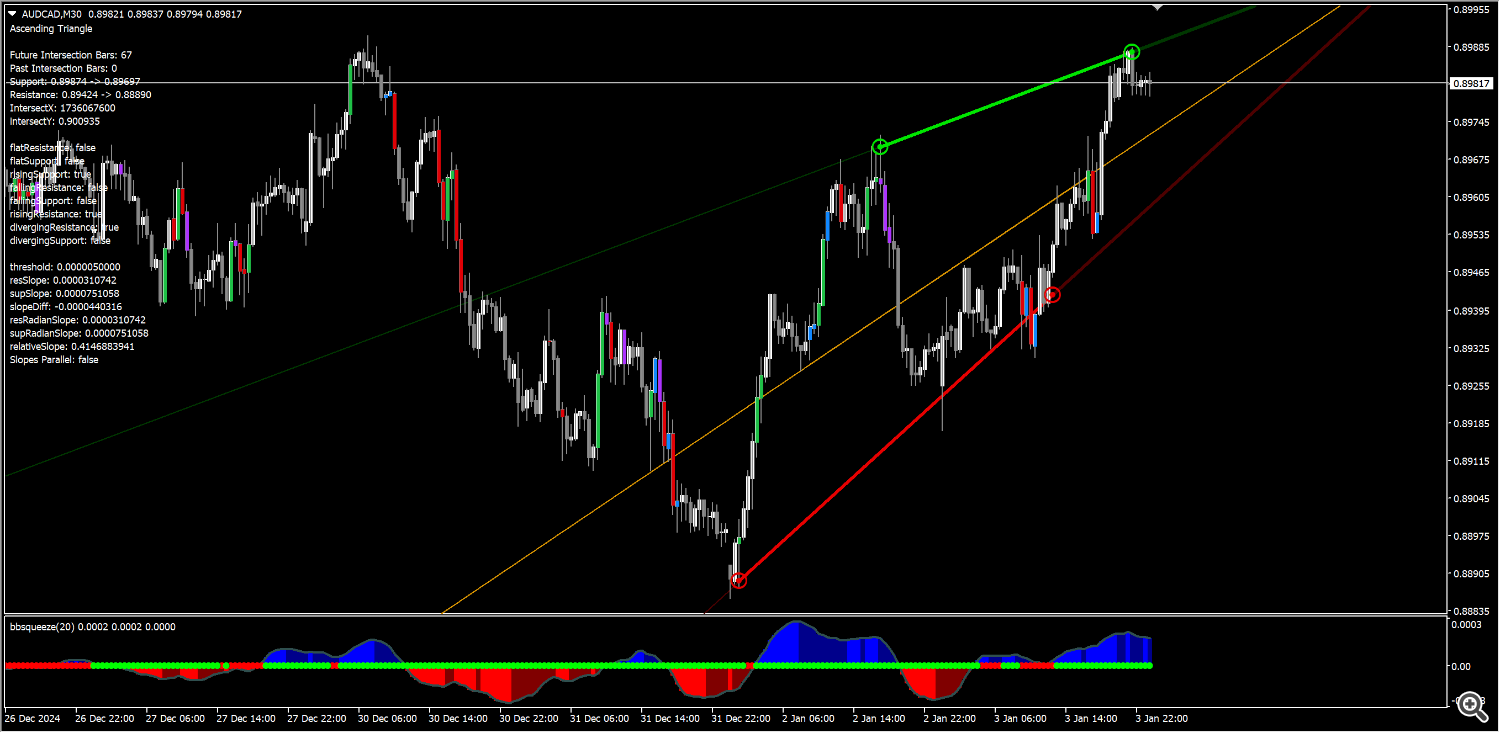
Abiroid Trendlines
60 $
- Triangle Types: Detects ascending, descending, and symmetrical triangles.
- Channel Types: Horizontal, rising, and falling channels.
- Scanner: Shows symbols for above trendline patterns
- Threshold: Adjustable sensitivity for slopes
- Breakouts: Alerts when price breaks out
All products are non-refundable. Since these are digital products. No source code available, only executables. Please read product description carefully before buying.
Abiroid TrendLines and Scanner
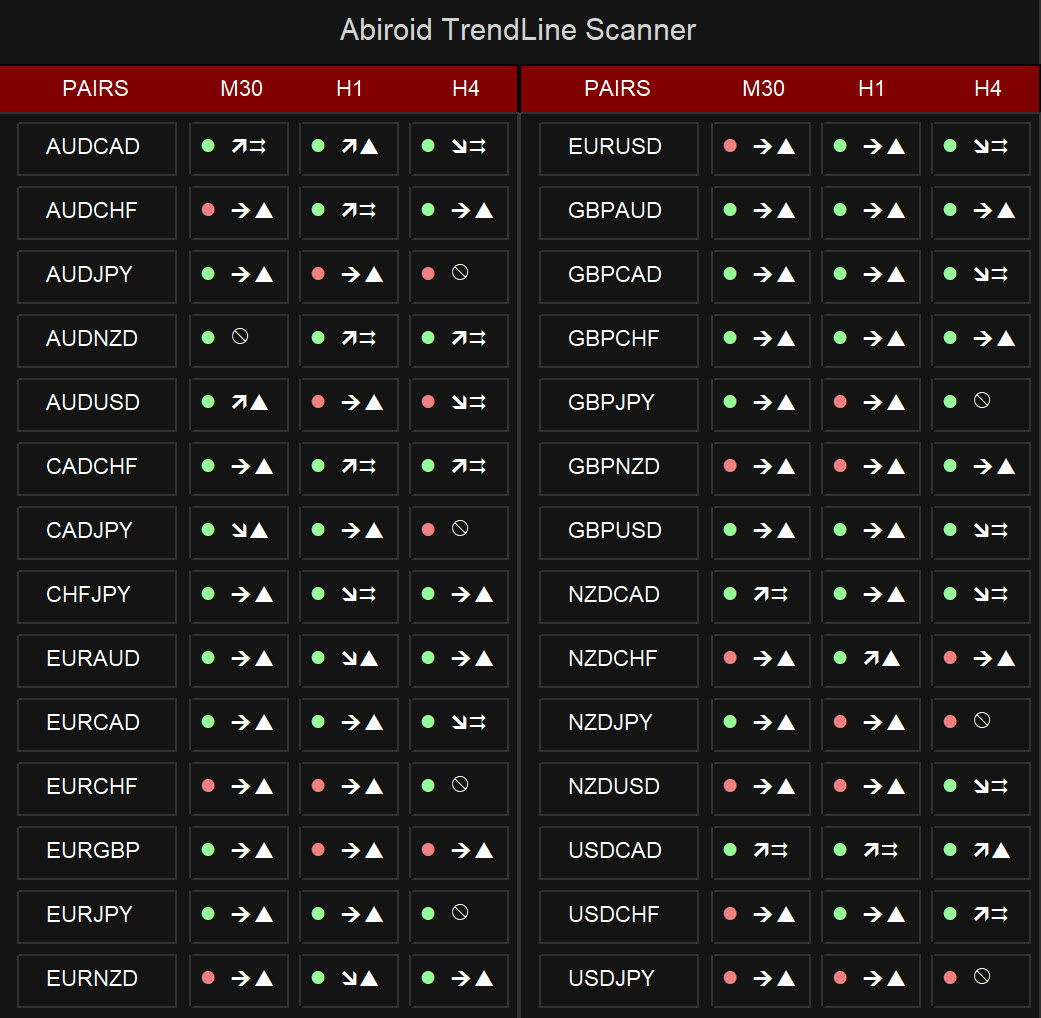
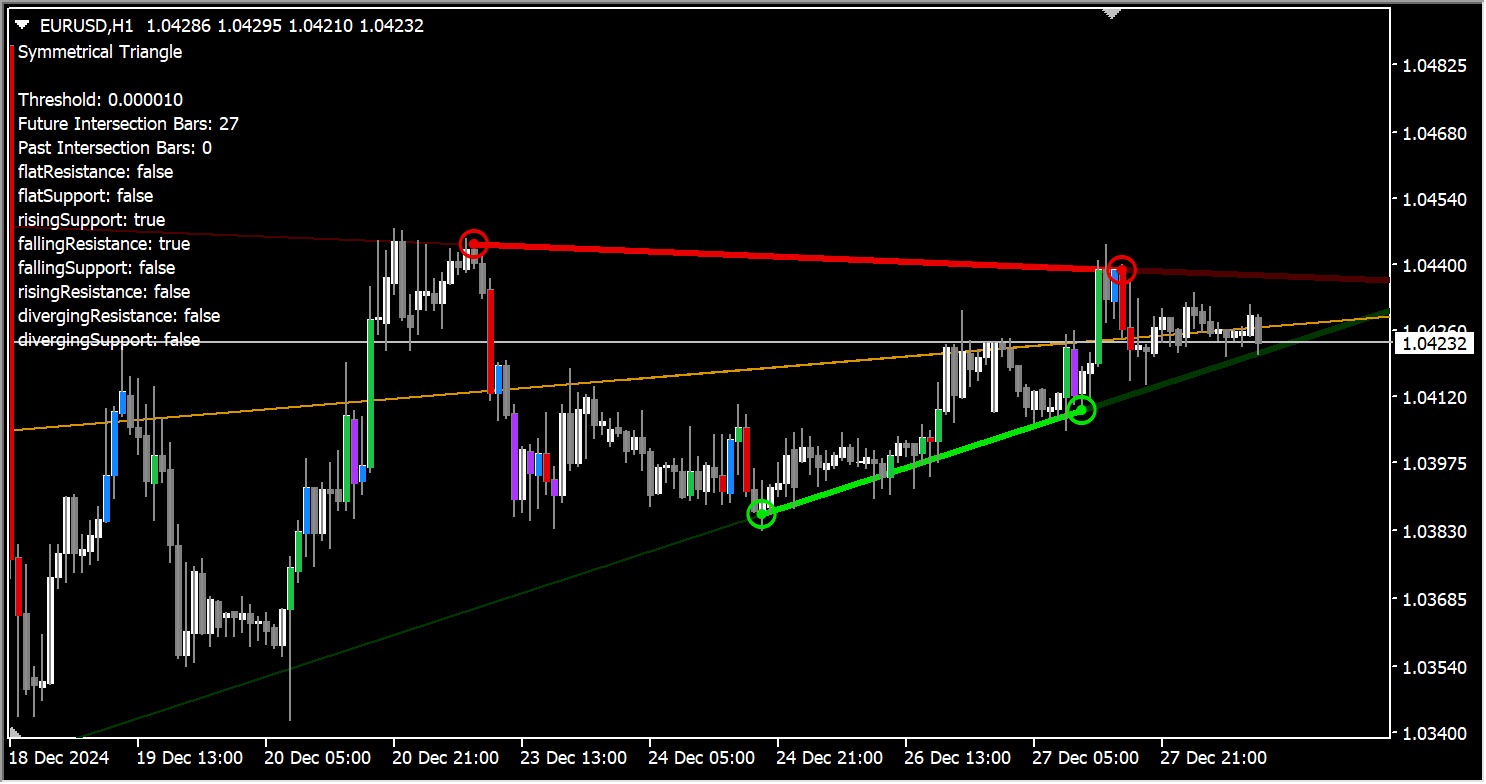
Available here:
https://www.mql5.com/en/market/product/129385/
And Free Scanner:
Scanner only works with the purchased Trendlines indicator. And it needs to be in same directory.
Features
- Triangle Types: Detects ascending, descending, and symmetrical triangles.
- Channel Types: Horizontal, rising, and falling channels.
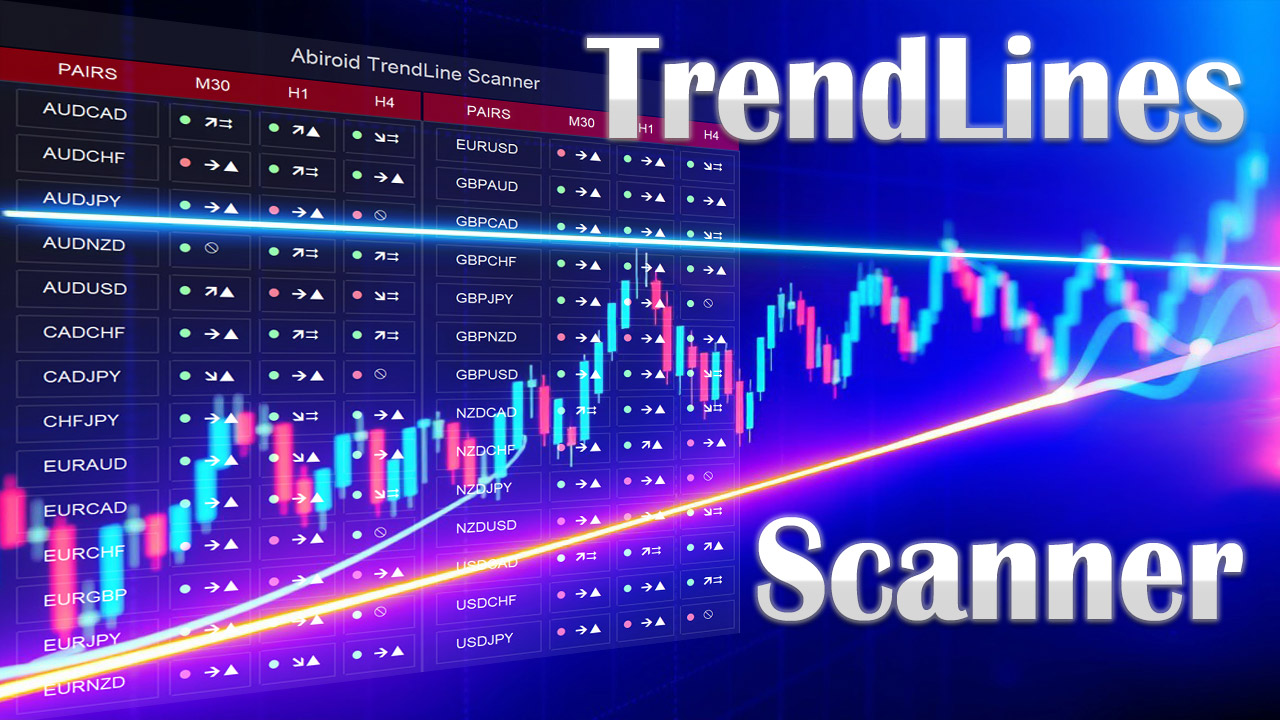
- Scanner: Shows symbols for above trendline patterns
- Threshold: Adjustable sensitivity for slopes
- Breakouts: Alerts when price breaks out
Note: Scanner limitations:
Future/past intersection points are only supported in Chart Trendlines and not scanner.
Since, trendlines need to be drawn on actual chart to project intersection.
Many people will use all 28 pairs with 3-4 timeframes, and it’s not a good idea to support opening multiple charts for each symbol/timeframe (28×4 charts)
Also, when using all 28 pairs and 4 timeframes, scanner will take 6-8 seconds every refresh. Depending on your PC. So set “Refresh After Ticks” accordingly.
Settings
Common Settings
https://www.mql5.com/en/blogs/post/747456
Resistance and Support Prices
To draw the trend lines it will find 2 points: R1 and R2 for resistance line above price. And S1 and S2 for support line below price.
By default it will use the highs for Resistance and Lows for Support. But you can change those to Closing price etc.
Scan for Pivot Points Using Base and Long Term Multiplier
Shift + (Min Scan Range * Long Multiplier)
Starting from the “Shift” bars, it looks back on candles to identify key pivot points.
Must be greater than at least 300 bars for accurate results.
Scan Window
Description: An extra range of bars for scanning pivot points.
Example: If set to 2, the window becomes:
Farther points (R1 and S1) are calculated using:
Change the multiplier to scan longer ranges. E.g for scalping use a small multiplier like 5:
And for finding longer more distant pivots and to avoid false breakouts, use a larger multiplier like 10:
Noise Reduction
Utilizes an EMA period with a noise reduction value to filter out insignificant highs and lows.
Helps smooth data for better trendline accuracy.
Appearance
Normally Support is green and resistance is Red. But for this indicator, I have used green for resistance. As a resistance breakout by an upwards moving trend will be bullish for ascending triangle/channel.
And a support line breakout for descending triangle/channel will be bearish.
You can change the line colors and mid line colors etc. Or line thickness for marking areas between R1 and R2 or S1 and S2 more clearly.
By default all Breakouts will be shown by a small dots, and strong breakouts will be green diamonds. You can change the strong breakout codes using Wingdings symbols:
https://www.mql5.com/en/docs/constants/objectconstants/wingdings
Breakouts:
Be careful with breakouts. And check the triangle shape.
The best kind of breakout will happen right after a low volatility period, when volatility increases.
A very tight trendline triangle will indicate a ranging period, then wait for a strong breakout in direction of that triangle.
A breakout for a symmetrical triangle could go either way. Breakouts during an expanding triangle will also usually go in direction of trendline slope.
Meaning if trendlines are making higher highs especially resistance, then upwards breakout is good for Bullish trades. And lower lows trendlines indicate Bearish Trend and will be good for Sell Trades.
Only strong breakouts have alerts. The weaker ones represented by smaller dots do not have alerts.
On scanner the weaker ones are shown as just text color highlights:
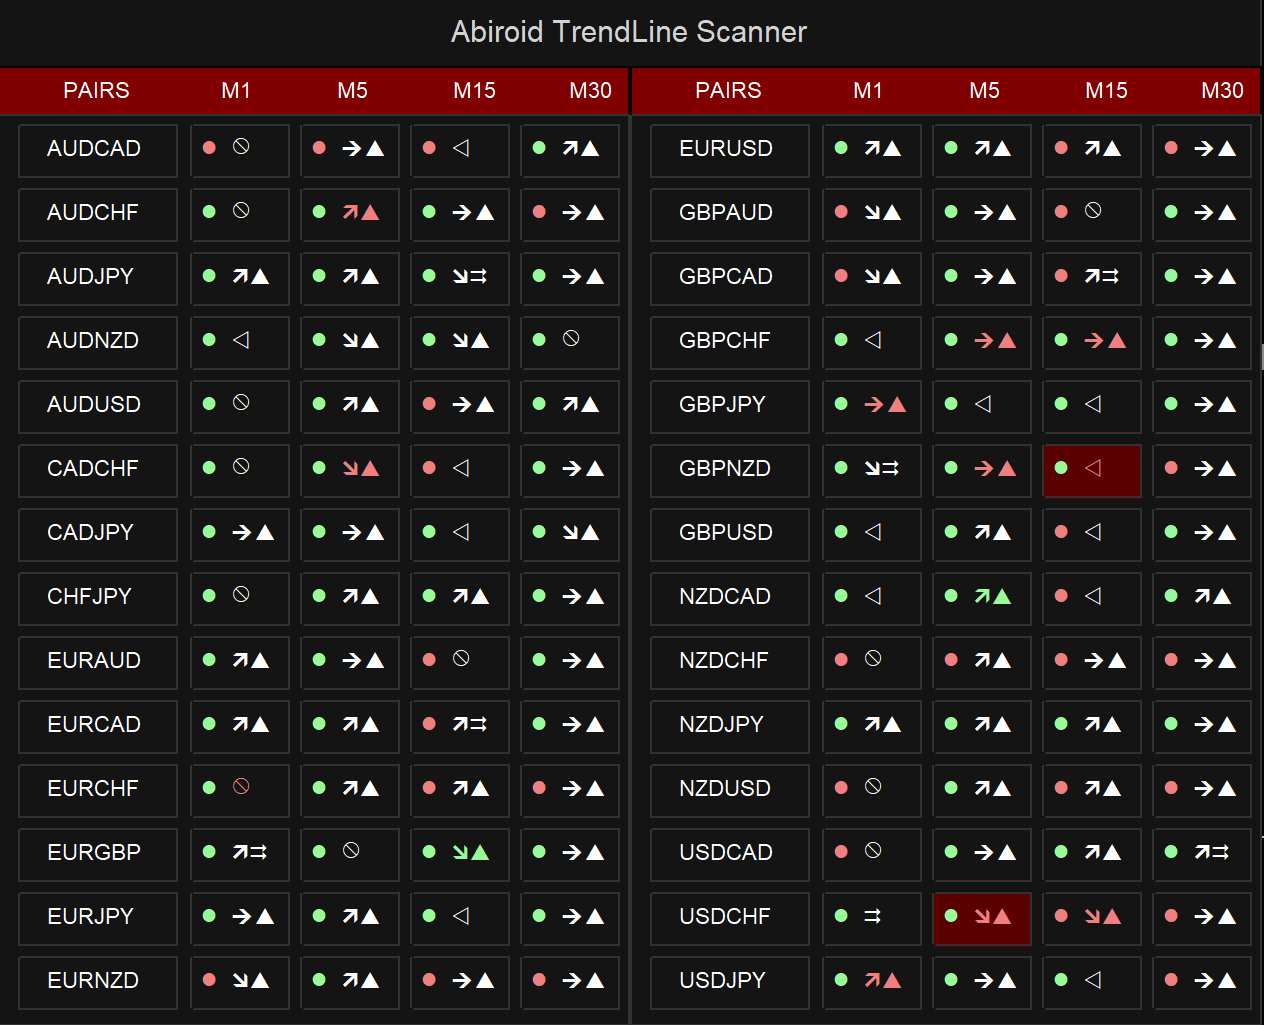
And on scanner strong breakouts are highlighted with background color and have alerts.
Breakout Types:

1. Ascending/Descending Triangles:
Use these types of breakouts when trading sudden volatility jumps in direction of Up trend (indicated by Ascending triangle)
Or Downtrend indicated by descending triangles.
2. Symmetrical Triangle:
Price could break out either way with these, so check high volume and high volatility for a breakout.
3. Expanding Triangle:
By the time price expands the trendline triangle, volatility has already increased quite a lot. So for this type, you can keep previous low volatility and then high volatility jumps off.
Just check for volume.
And make sure that price is not near any important SR levels. As it could reverse even after breakout. So be careful of false breakouts near Support/Resistance areas or Quarter points or Pivots, etc.
Volatility Detection:
It uses BB Squeeze for finding volatility using the attached bbsqueeze_dark_alerts 2.01.ex4:
You can define how many low volatility bars, before the high volatility breakout.
And if Breakout type is strict, then it will only show breakouts when trend is strong in ascending for bullish and descending triangle/channels for Bearish.
This will limit signals a lot but will only give breakouts in direction of trends.
Thresholds and Slope Calculations:

It will use a Threshold Multiplier to set checks for finding the Triangle/Channel type using the Point value for pairs.
Threshold = Point for the Symbol x (ThresholdMultiplier for Ascending/Descending)
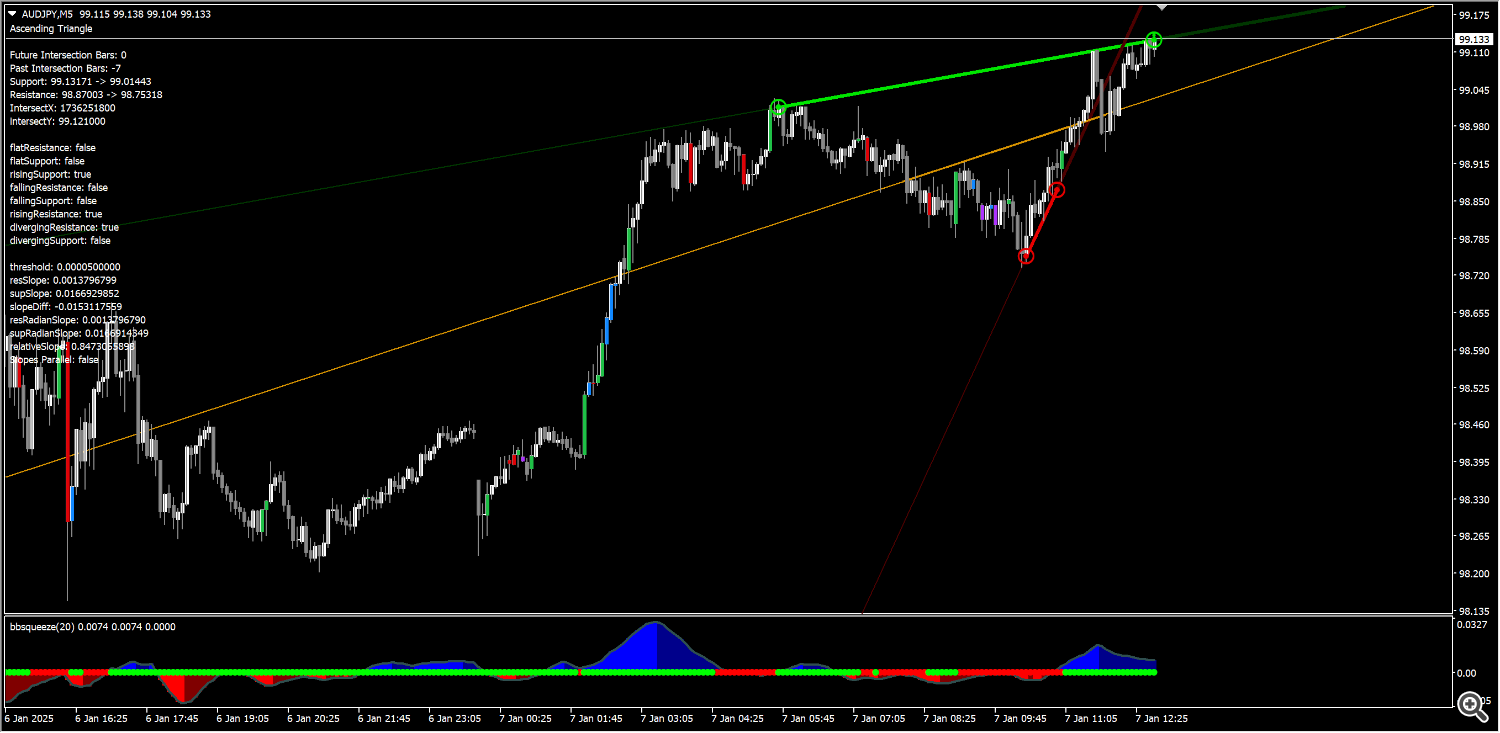
Slope Difference = Difference between Radian Slope of Resistance and Support

Relative Slope Diff = Slope Diff / Slopes added
Flat Resistance/Support = if Resis/Support Slope less than Threhold
Rising Resis/Support = if Resis/Support Slope more than Threhold
Falling Resis/Support = if Resis/Support Slope less than (-Threhold)
For a Diverging Resistance, it needs to be going above Threhold
For a Diverging Support, it needs to go below -Threhold
Triangles:
Expanding = Support and Resistance are Diverging
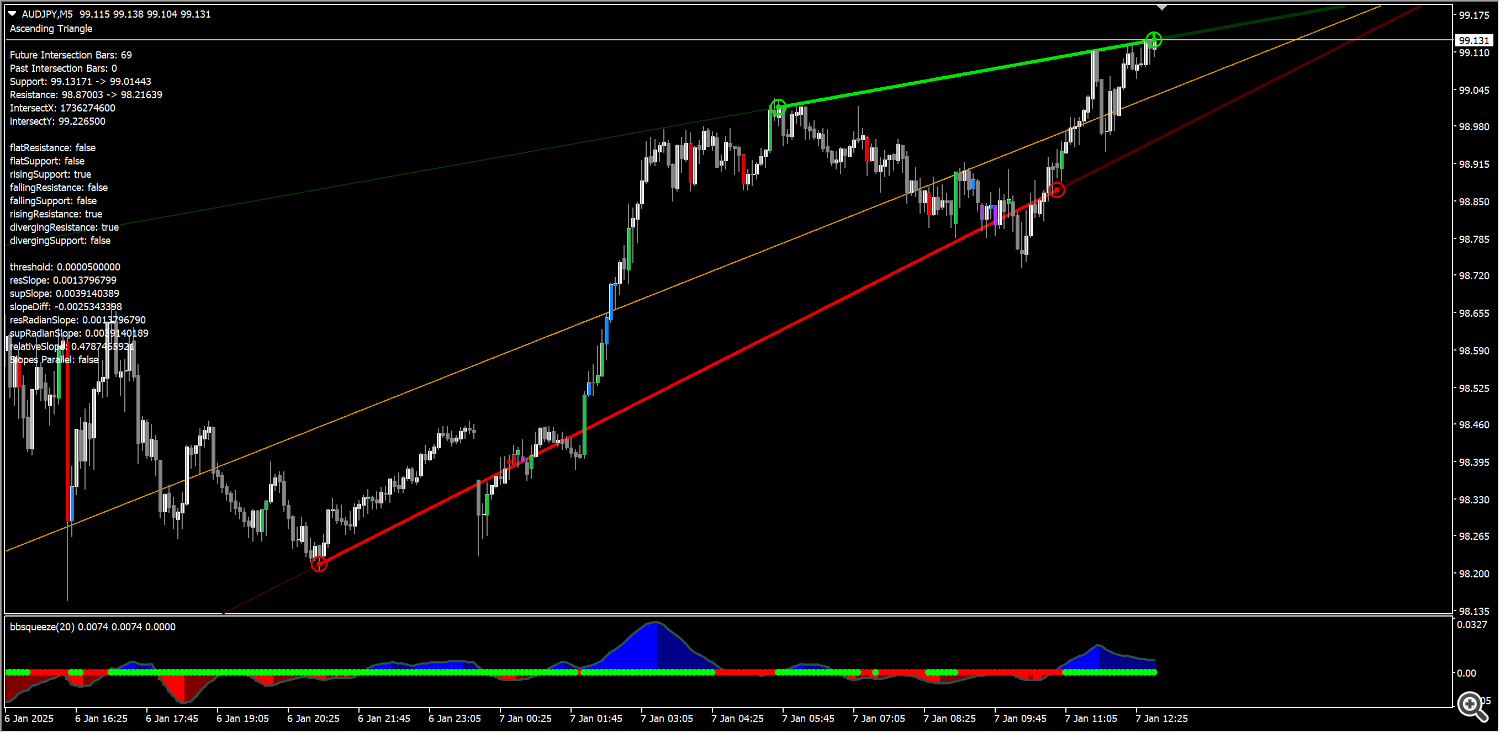
Ascending = Support is rising and Resistance is Flat/Rising
Descending = Support is flat/falling and Resistance is Falling
Symmetrical = Support is rising and Resistance is falling
For finding Channels:
Slopes Parallel if relativeSlopeDiff < (Threshold Multiplier for Slope x Point)
So, depending on Slopes and Thresholds set:
And Ascending Triangle can be like:
Whereas an Ascending Channel will be like:

What Each Scanner Symbol Means
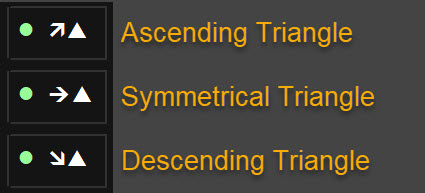
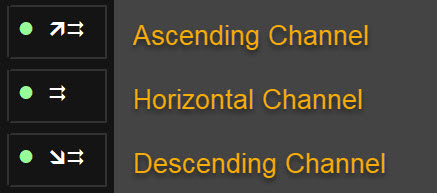
No Pattern especially when slope is still forming and only 1 point of trendline is drawn for now:


Background color in a block will mean strong breakout. While just text color changes will mean weak breakouts:

How to Debug
Show Info In Comments:

Enable Detailed Logs: Set DetailedDebugLogs to true.
Specify Symbol and Timeframe: Use DetailedDebugPair and DetailedDebugTF to focus on specific pair/TF in scanner.
When Not to Trade
- Low Volatility: Avoid trading during periods of low volume as breakouts may be false.
- Be cautious during choppy markets or sudden jumps.
- Unclear Patterns: If the trendlines are not clear, it is better to wait for a more defined pattern.
Conclusion:
Use the Trendlines to find good breakouts. And use it with your existing trend-based strategies.
Be careful to always validate your trades and not use just trend lines as a standalone strategy.
As it can give false breakouts especially when going against overall trend.
| mql_site_link |
|---|
Related products
Abiroid Quarters Scanner
Darvas Box Strategy Arrows and Scanner
- Check Darvas Box Breakout
- Check Price Above/Below MA or Darvas Box has crossed MA
- NRTR Trend Check
- Heiken Trend Check
- MA Slope Check
- Higher Timeframes Price and MA check
- Fixed Stop Loss and Take Profit Option
- Variable Stop Loss at Darvas Box or Darvas Pivots or selected MA
- Calculation of Profit Loss Points and Win/Loss Count and Profit Percentage
Abiroid 3LZZ Simple Semafor Scanner
Abiroid Auto Fibo Indicator
- Blue Diamond if price Price crosses towards Trend
- Orange Diamond if price reverses towards retracement
Abiroid MA Stack
Abiroid EMA Scalper
ProfitPercent Arrows MA Confluence
- Main Signal Indicators (Any One): MA Cross (In-built) or Hull, OBV Cross, Heiken Ashi Cross
- Validation Indicators (Preferably less than 3): OBV (with Min Distance), Heiken Ashi, ADX, SuperTrend, PSAR, Higher TimeFrame EMA Alignment
- If MA Cross and OBV Cross both are false, only then Heiken Cross will be taken as Main Signal.

