Profit Percent Stoch Ichimoku with ATR
60 $
Coming soon on MQL5. Contact me.Main Signal, Trend Check and SL/TP Prediction:
- Stochastic/RSI/CCI OB/OS (Main Signal)
- Ichimoku/EMA Current TF and HTF(all optional):
- ATR (SL/TP Prediction)
All products are non-refundable. Since these are digital products. No source code available, only executables. Please read product description carefully before buying.
Download Demo:
Note: Demo only works for EURUSD.
Download Extras:
Download Free Scanner:
You can also Buy Arrows from Metatrader:
Arrows:
https://www.mql5.com/en/market/product/48565/
Watch Tutorial here:
Updates:
v1.1:
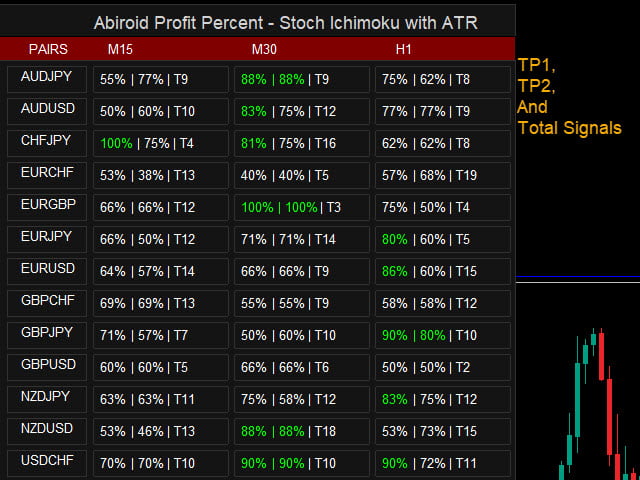
Added Total Number of Signals to Dashboard. After TP1 | TP2. Specified with letter T:
(Note: This feature is not described in the video as it was added later)
About The Strategy:
This strategy has 3 main parts.
Main Signal, Trend Check and SL/TP Prediction:
1. Stochastic/RSI/CCI OB/OS (Main Signal)
This allows you to use multiple indicators (comma separated names and settings)
Indicator1: (Main Signal)
For BUY: Oversold crossed and back
For SELL: Overbought crossed and back
Indicator 2+ (Validating Indicators – Optional)
Both BUY and SELL Signals will check if Indicator 2 and more are inside safe OverBought/Oversold range.
If you specify OB/OS like 80/20. To check the reverse condition where Stoch is beyond OB/OS use: 20/80 instead.
In most cases the reverse condition gives better percentages.
Once a successful signal is generated, it will check the trend next:
2. Ichimoku or EMA Higher TF (Trend Check Optional)
Use Ichimoku:
Possible Checks (all optional):
For BUY:
- Price above Kumo Cloud (at least Min Distance away Points)
- Tenkan above Kijun (Min Distance)
- Chikou Span away and above Kumo Cloud (Min Distance)
- Chikou Span away and above Price (Min Distance)
For SELL, same settings only vice-versa
Learn more about Ichimoku and different strategies here:
https://tradingstrategyguides.com/best-ichimoku-strategy/
Use EMA for Higher Timeframes (also Optional):
You can specify number of Higher Timeframes for which you need to check EMA Trend for.
If you are trading on M30 and you keep Check EMA HTF number to “3”
Then it will check trend for current timeframe M30 and 2 higher timeframes H1,H4.
If it sees all trends aligned then it will allow the BUY/SELL Signal.
3. ATR (SL/TP Prediction)
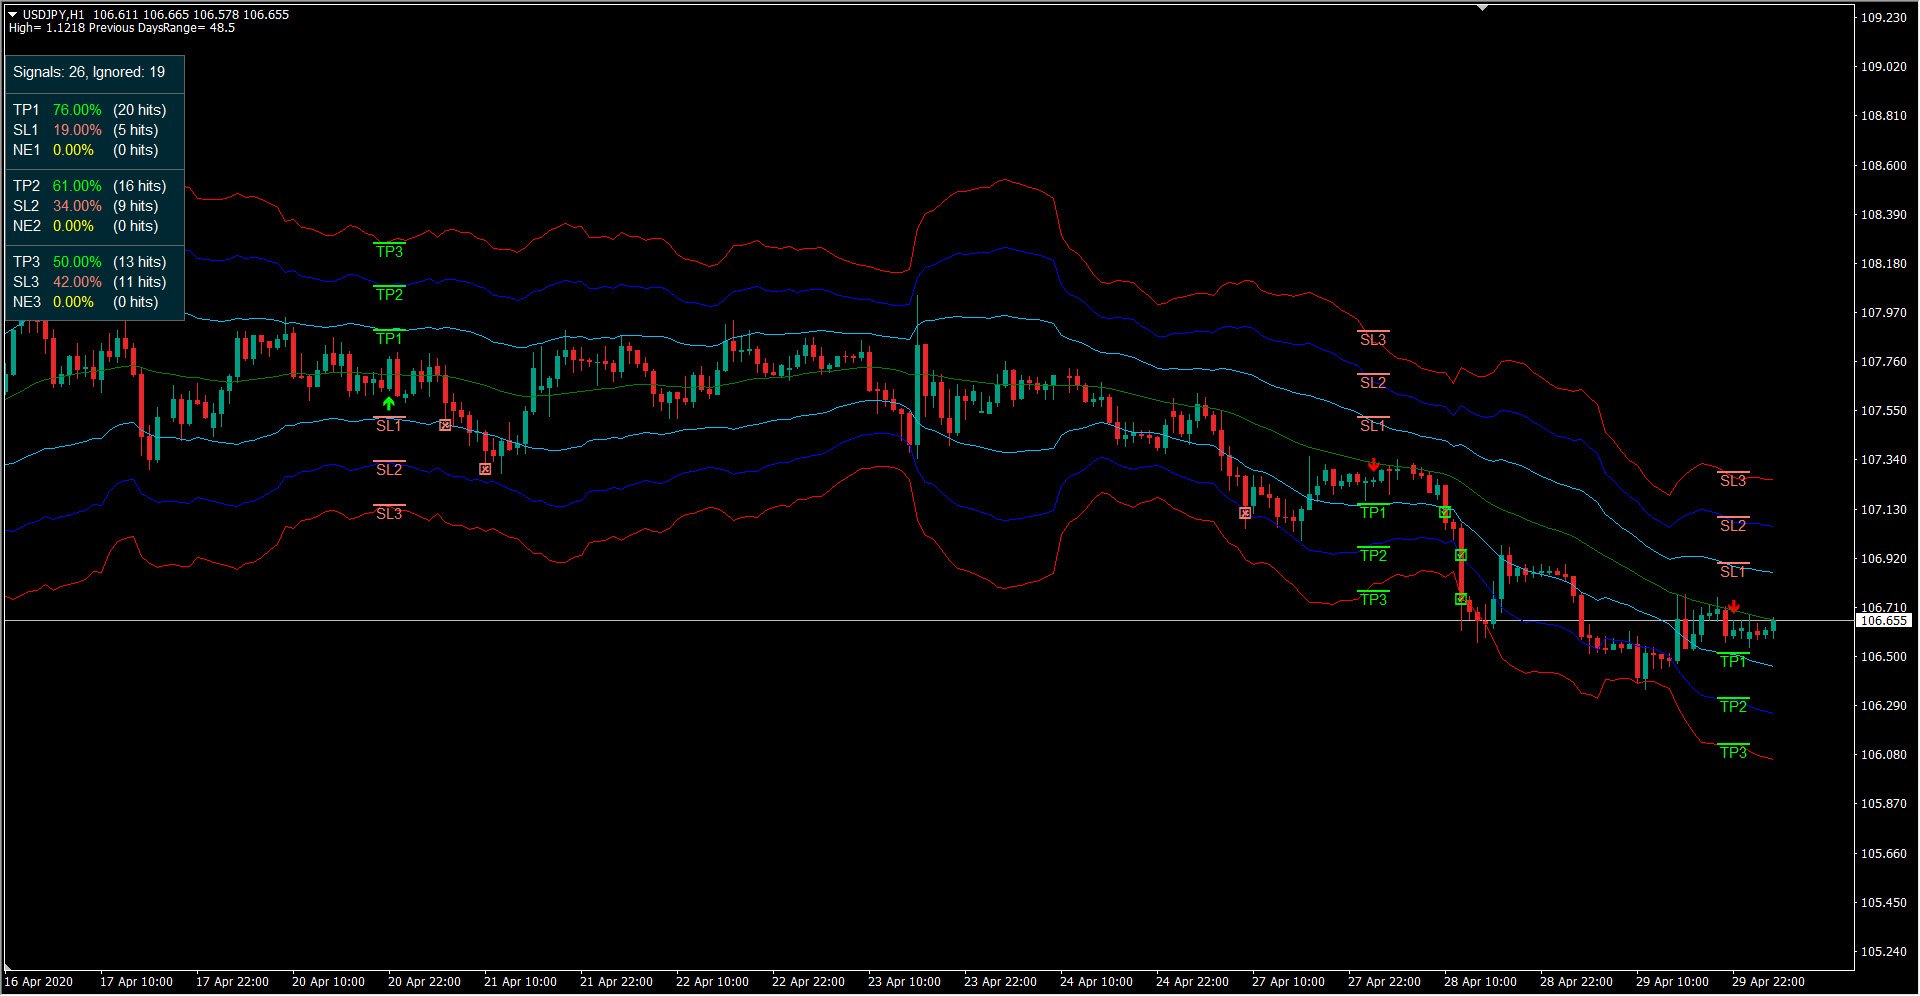
The Take Profit and Stop Loss are predicted using ATR Channels. There are 6 channels available.
You can specify how which channel is for TP and SL.
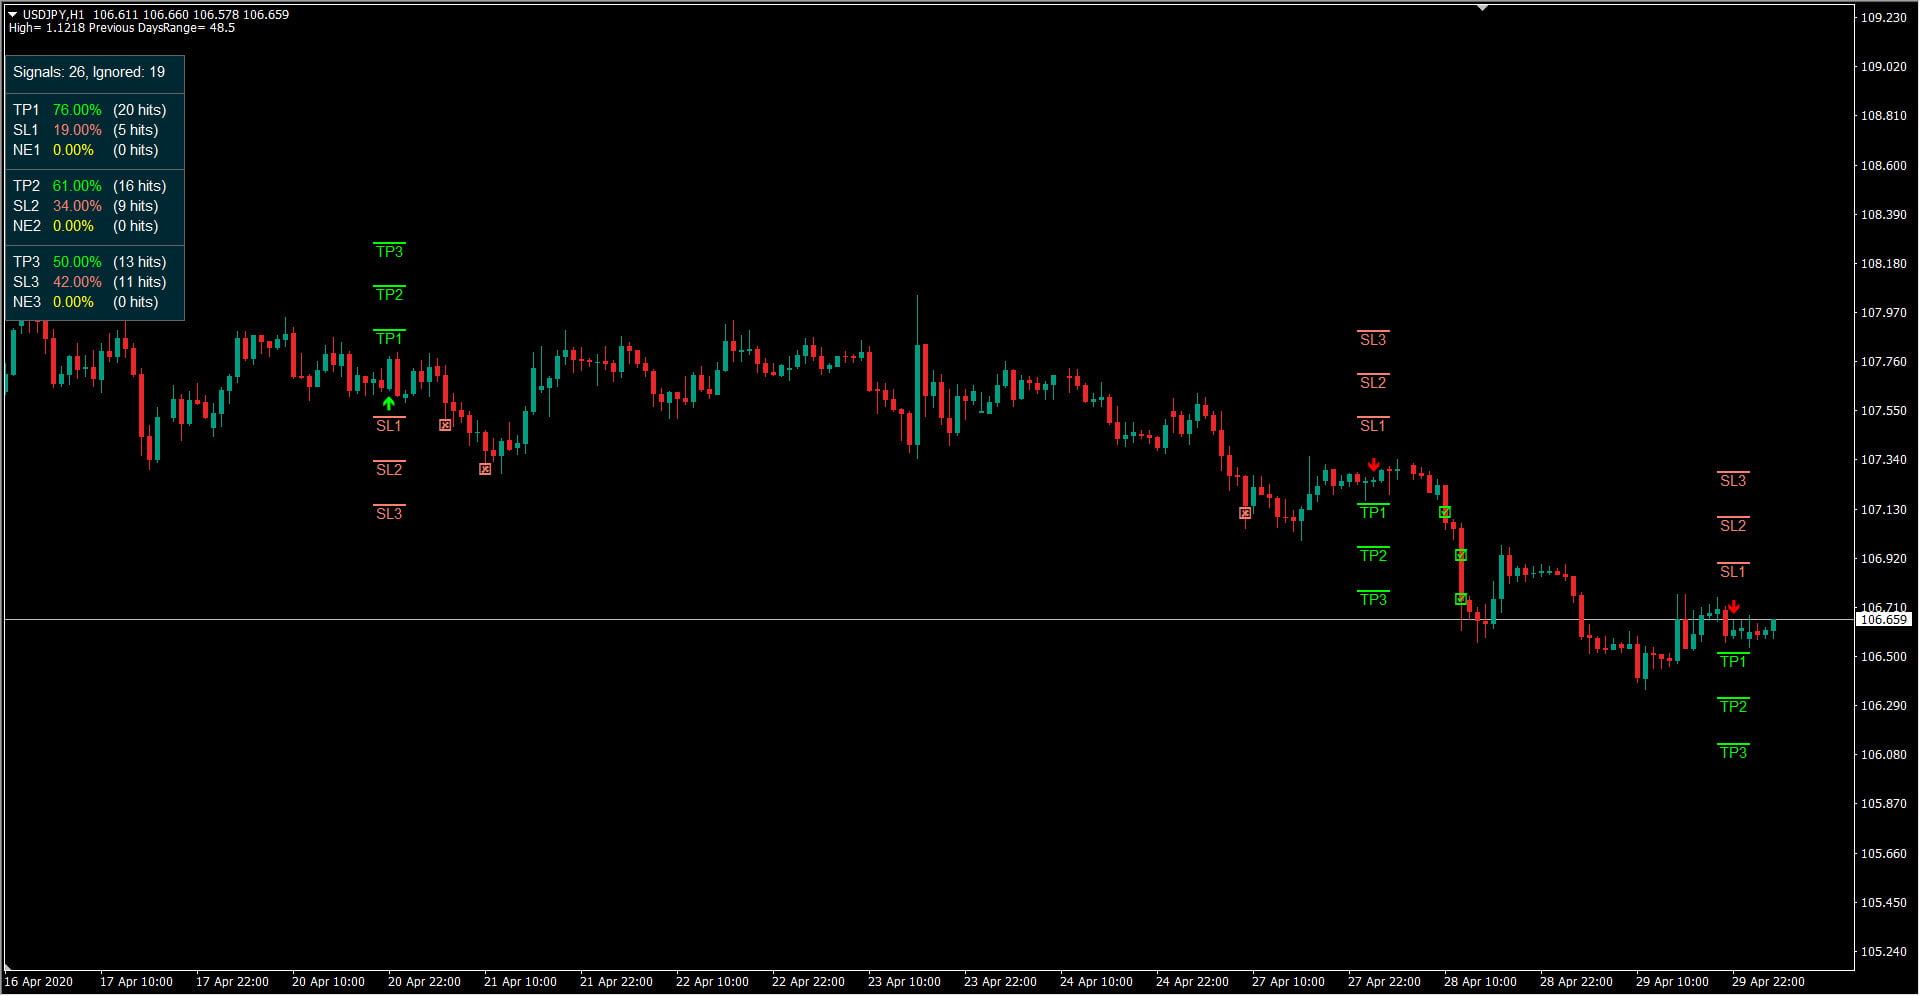
Suppose you are using TP1,TP2,TP3 and SL1,SL2,SL3 as shown in image:
It will compare past bars and check if TP1 was hit or SL1. TP2 is compared with SL2 and so on.
Indicator will show you a percent of successful TP1, 2 or 3 Profits. Or unsuccessful hits and losses with SL Percentage.
Setting Details:
1. Base Settings:

Override Settings:
Name of a .set file which will Override all Indicator settings. It has to be inside Metatrader’s MQL4/Files folder. Or else it won’t be able to find it.
This is useful if you are using this arrows indicator with an EA and have multiple SET Configuration Files.
Prefix:
A unique prefix which is used to create all the Arrows, Panels and Dashboard elements.
If you are using multiple dashboards on same chart, then make sure this Prefix is unique.
Suppose your prefix for one dash is “ABC” and another dash is “ABC1”, then since “ABC” is not unique, there will be naming conflicts.
And if you unload “ABC” dash, it might unload all elements from “ABC1” dash as well.
So use unique prefixes like “ABC1” and “ABC2”.
MaxPastBars:
Number of bars for which all Calculations are to be made: TP/SL lines and comparisons, percentage, Stats etc.
Signal Settings: Stochastic/RSI/CCI
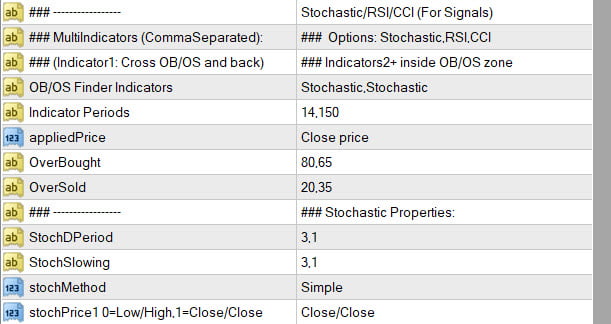
OB/OS Finder Indicators:
Comma separated names of Indicators.
Indicator Periods, OverBought, OverSold, StochDPeriod, StochSlowing: All are comma separated values for the multiple indicators you specified.
Indicator 1: First indicator is used to generate the main signal. It can be Stochastic or RSI or CCI.
For BUY: It will check if that Indicator had gone OverSold and back.
For SELL: It will check if Indicator had gone Overbought and back.
Indicator 2+: Second Indicator and more are used as a validating Indicator, to make sure that for a higher period, price is safely between OB and OS levels.
These can also be Stochastic or RSI or CCI.
By default period 14 is used for Indicator 1 (Main Signal) and Period 150 is used for Indicator 2 (Validating Indicator).
All other settings are default Stochastic settings.
2. Trend Settings: Ichimoku and EMA
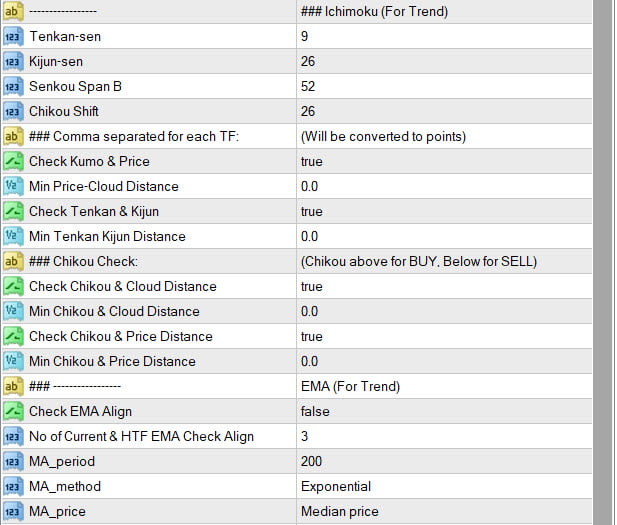
You can use Ichimoku or EMA or both to determine a good trend. If these checks are true, then only arrows towards current trend will be used as signals.
All Ichimoku Settings are default values: Tenkan-Sen, Kijun-Sen, Senkou Span B, Chikou Shift.
Ichimoku checks (Optional):
For BUY:
- Price above Kumo Cloud (at least Min Distance away Points)
- Tenkan above Kijun (Min Distance)
- Chikou Span away and above Kumo Cloud (Min Distance)
- Chikou Span away and above Price (Min Distance)
For SELL, same only vice-versa.
All Min Distances are in Points. Suppose for EURUSD, you use points 50 for MinDist check for Kumo and Price.
And price is currently at 1.10000. Then for BUY it will check that Price is at least 1.10050 distance above Kumo.
EMA checks (Optional):
Check EMA Align: If true, it will check current EMA and higher timeframes EMA for trend alignment.
No of Current & HTF EMA Check Align: Number of EMAs to check for trend alignment.
Suppose this number is 3 and current timeframe is M30.
Then for BUY, it will check M30, H1 and H4 EMA and make sure that price is above all the EMAs.
Price above EMA will mean a strong upwards trend.
Keeping EMA check to true gives you very accurate signals, but much fewer signals.
So, suppose you only need to trade long-term and towards trend, use these trend settings as true. Or some of them based on your strategy.
But if you also want to trade retracements and smaller reversals like in scalping, then keep trend settings to false.
But note that without any trend checks, the profit percentages go very low. So be careful during scalping.
3. ATR SL/TP Settings and Stats Calculations:
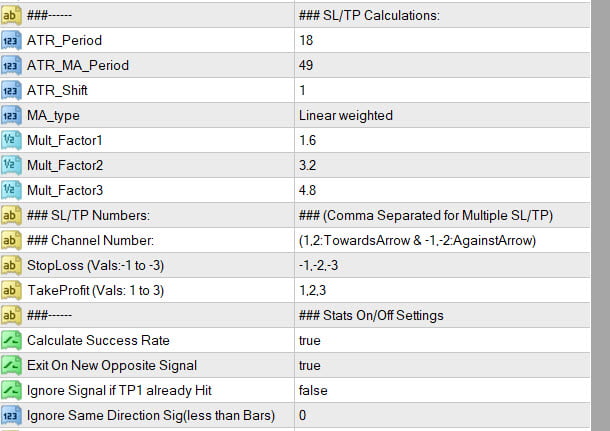
ATR works on Market volatility. So, it is good for calculating Take Profit and Stop Loss.
Because when market is really trending it will give higher SL/TP distances. And when market is slow and ranging, it will keep SL/TP closer.
In the downloads below, you can find the ATR Channels indicator which generates the SL/TP values.
SL/TP Settings:
ATR Period, MA Period, MA_Type: All calculate the ATR Channels.
ATR Shift: Bar number to calculate ATR Channel values
By default Arrows are generated for Bar 1 because that candle has fully closed.
So, if ATR Shift is 1, it will use ATR value for candle 2. If ATR Shift is 2, it will use Channels for Candle 3 and so on.
Mult_Factor1,2,3: 3 Multiplication factors for generating Channels.
There are totally 6 channels: 3 above price and 3 below.
The 3 above price are 1,2,3 and below ones are -1,-2,-3 as follows:
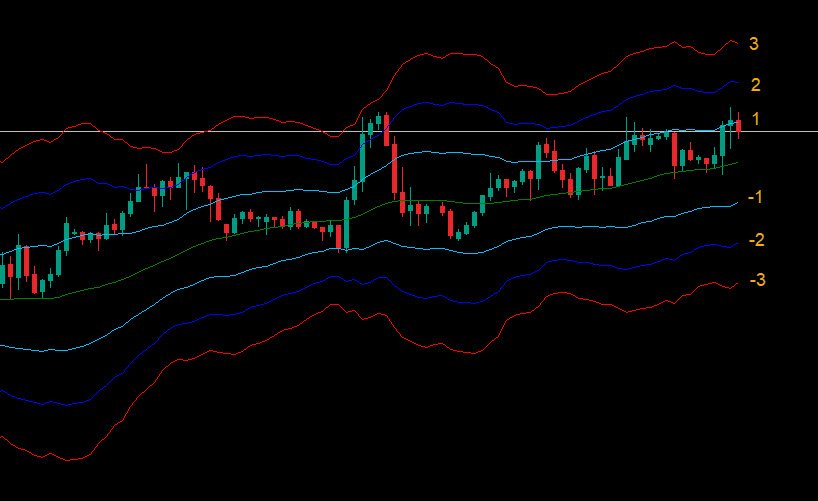
StopLoss and TakeProfit Values: Comma separated values for channel number where it draws StopLoss or TakeProfit.
Suppose for SL values used are -1,-2,-3. Then it will use those channels for SL1,SL2,SL3.
And for TP if using 1,2,3 values, it will set those channels for TP1,TP2,TP3.
Then it will compare TP1 with SL1 and see which is hit first. And TP2 with SL2 and so on.
Stats Calculations:
Calculate Success Rate:
If false, then it only shows arrows and it does not calculate SL/TP and % success rates.
Exit On New Opposite Signal:
Suppose if a particular TP/SL combination is not hit yet. Like TP3/SL3 still remains and a new arrow signal appears. And arrow is in opposite direction, then signal is considered as Loss.
And NE3 (New Exit 3) Signal count is increased and it’s percent is calculated.
Ignore Signal If TP1 already Hit:
If Price has already reached TP1 when an arrow occurs, then you can ignore such signals:
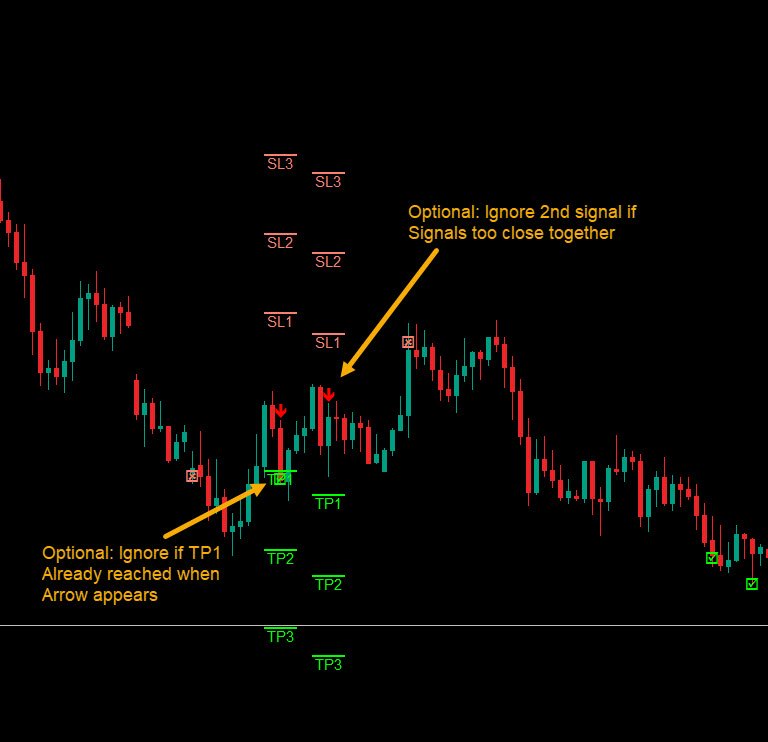
Ignore Same Direction Signal (less than Bars):
If multiple same direction BUY/SELL signals occur, then you can specify a Min number of bars for which same signal will be ignored.
Suppose this value is 10. If a BUY signal appears and another BUY appears before 10 bars are finished, then the second signal will be ignored.
Keep it to 0 to not use this feature.
Alerts and Stats Panel:
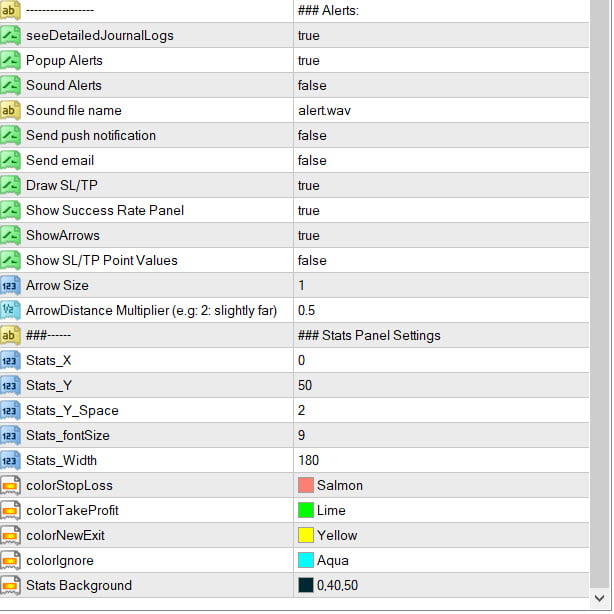
Alert Options For Popup/Sound/Push/Email: true/false
Show/Hide: true or false
- Success Rate Panel: If false then hide Success Panel
- Show Arrows: If false then hide all arrows
- SL/TP Point Values: If false then hide SL/TP point values in brackets
- SL/TP Labels: Show/hide “SL1”, “TP1” etc labels. If false, only show the SL/TP line and not labels
SL/TP Labels Font Size: Font size for “SL1”, “TP1” etc labels
Arrow Size: To get bigger arrows increase size
ArrowDistance Multiplier: To make arrows farther from price increase this. To bring them closer, decrease this multiplier value.
Value 0 means arrow will be touching price High/Low.
Stats Panel Settings:
Stats_X, Stats_Y: Spacing Stats Panel. X is for left space and Y is space from top.
Stats_Y_Space: Space between each line in Stats Panel.
Stats_fontSize: Font size of Stats Panel Text
Stats_Width: Width of Stats Panel
Colors for SL/TP Lines, New Signal Loss Exit Cross color and Stats Background color.
Dashboard Settings:
Almost all dashboard settings are same as the Arrows Indicator Settings.
Here are the additional Dashboard Settings:
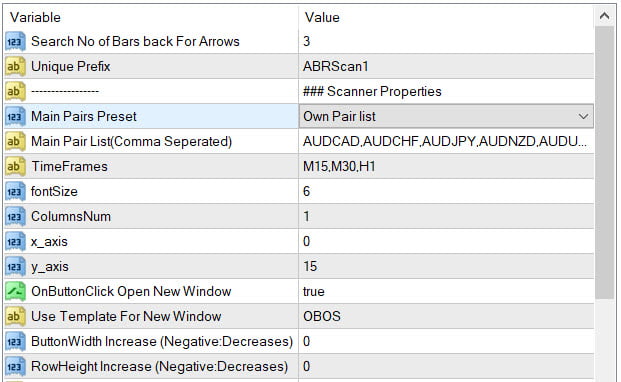
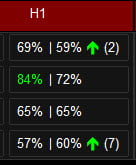
Search No of Bars For Arrows:
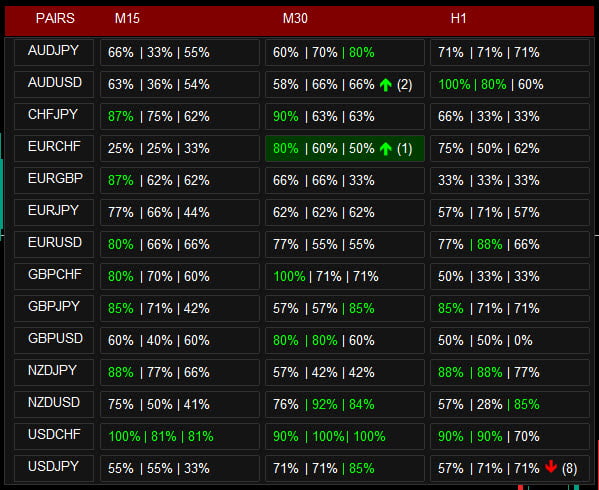
Look for arrows in previous number of bars and show the arrow and bar no. in brackets like this:
Unique Prefix:
Keep it unique if you need to use multiple dashboards on same chart. Make sure other indicators on same chart are not using this prefix.
Comma-separated lists:
- Own Pairs List or Select pairs list from drop-down like “Forex Core 7”, “Forex Core 14”, etc.
- Time frames e.g.: M15,M30,H1
- x_axis, y_axis: to position Scanner Dashboard
- fontSize: resize whole panel and fonts. Use fontSize between 5 and 8.
- ColumnsNum: No of Dashboard Columns
- OnButtonClick Open New Window: On clicking any button open that Pair-TimeFrame in a new window with your template:
- Use Template for New Window: Template name. Eg: Create a file Template1.tpl in templates folder and here specify: “Template1” or “Template1.tpl”
Template should be in templates folder.
(only works if previous property set to true). Does not work if “OnButtonClick Open New Window” is false.
- Button Width and Row Height: Positive value will increment it and negative value will decrease it.

- BuySignalClr and SellSignalClr: Background cell color. When a BUY or SELL arrow occurs on candle 1.
- TP% Threshold: Green Highlight Take Profit values above Threshold.
E.g: If threshold is 80%:

That’s it for settings. Downloads section has some good sample settings you could try. Along with extra indicators and templates.
Happy Trading!!
Changelog:
v1.1 Added Total Number of Signals to Dashboard. After TP1 | TP2. Specified with letter T
Fixed a bug of wrong percentages in some pairs.
v1.2 Added fix for allowing pairs named:
EURUSD# with a hash as some brokers use that naming convention.
v1.3 – Added SL,TP Price Values in Buffers when arrow occurs
– Removed isCalculateSuccessRate and made it mandatory by default
– Added option to “Show SL/TP Hit Tick” or hide them.
Added options for:
– Fixed TakeProfit and StopLoss (In Points)
– And TakeProfit = SL1xFactor or StopLoss = TP1xFactor
User can define the factor. If e.g. Factor is 2 and TP1 is fixed and SL is TP1xFactor. Then SL1 = TP1x2 (i.e. Twice as far as TakeProfit)
Both SL and TP can’t be xFactor of each other. One of them needs to be ATR or Fixed.
v1.4 – Added MFI Indicator
– Arrow will now appear on Open of New bar.. If BUY/SELL validation checks on close of previous bar
– Added Entry Point lines
– Added option for displaying Price on SL/TP labels
– Added option to make “Use MA+ATR” Optional for calculating ATR Channels.
v1.5 Fixed bug: “No Signals” text not being reset. And incorrect TP values in scanner.
v1.6 Added DeMarker indicator
v1.7 Added Option for Detailed Alerts to show alerts with SL/TP values
Related products
Darvas Box Strategy Arrows and Scanner
- Check Darvas Box Breakout
- Check Price Above/Below MA or Darvas Box has crossed MA
- NRTR Trend Check
- Heiken Trend Check
- MA Slope Check
- Higher Timeframes Price and MA check
- Fixed Stop Loss and Take Profit Option
- Variable Stop Loss at Darvas Box or Darvas Pivots or selected MA
- Calculation of Profit Loss Points and Win/Loss Count and Profit Percentage
EMA Bounce Strategy
Abiroid 3LZZ Simple Semafor Scanner
Abiroid Auto Fibo Indicator
- Blue Diamond if price Price crosses towards Trend
- Orange Diamond if price reverses towards retracement


Dear Abi,
You have amazing indicators 🙂
Is it possible to make in this indicator to get a signal for telegram? Many times I cannot be in front of the pc, but I can follow the signal on telegram, because many times I am out working.
Hi,
You can set File Alerts to true
Which will create an Alert file in your Files folder.
Then you can use this Telegram Forwarder EA in a separate chart:
https://abiroid.com/product/abiroid-dashboards-to-telegram-ea
It will wait for any Alerts to your File. And works with all my scanners.
You’ll need to setup a Telegram Channel for it to work. The detailed steps are in it’s description.
Please note that screenshots can be a bit slow or buggy if too many Metatrader charts are open or if template is a bit heavy, and if Metatrader is slowing down.
Because screenshots are based on time (seconds) you define, to open Template in a chart and take a screenshot and then send it to your Telegram.