Simple Waddah Multimeter
0 $
Get from MQL5- Waddah Trend Direction
- Trend Strength (above/below explosion line or deadzone)
- Trend Explosion Alert
- Alignment alerts
- Multi-timeframe
- Custom currency
- Multi indicators on same chart (unique prefix)
All products are non-refundable. Since these are digital products. No source code available, only executables. Please read product description carefully before buying.
About Waddah Multimeter (free):
This product is based on the WAExplosion Indicator. It helps identify explosive market trends and potential trading opportunities.
It contains a pack of 2 indicators:
- Modified WAExplosion to Show Trend Power and Explosion Power in Buffers
- Waddah Multi-meter (Multi-timeframe)
Features:
- Waddah Trend Direction
- Trend Strength (above/below explosion line or deadzone)
- Trend Explosion Alert
- Alignment alerts
- Multi-timeframe
- Custom currency
- Multi indicators on same chart (unique prefix)
With Alerts on Alignment.
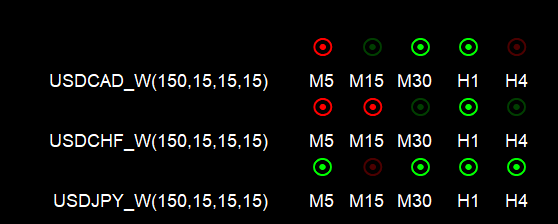
You can have as many on chart with different pair names:
and set the spacing using Y coordinates.
Use different unique prefixes for all.
And you’ll get alerts on alignment:
Video Tutorial:
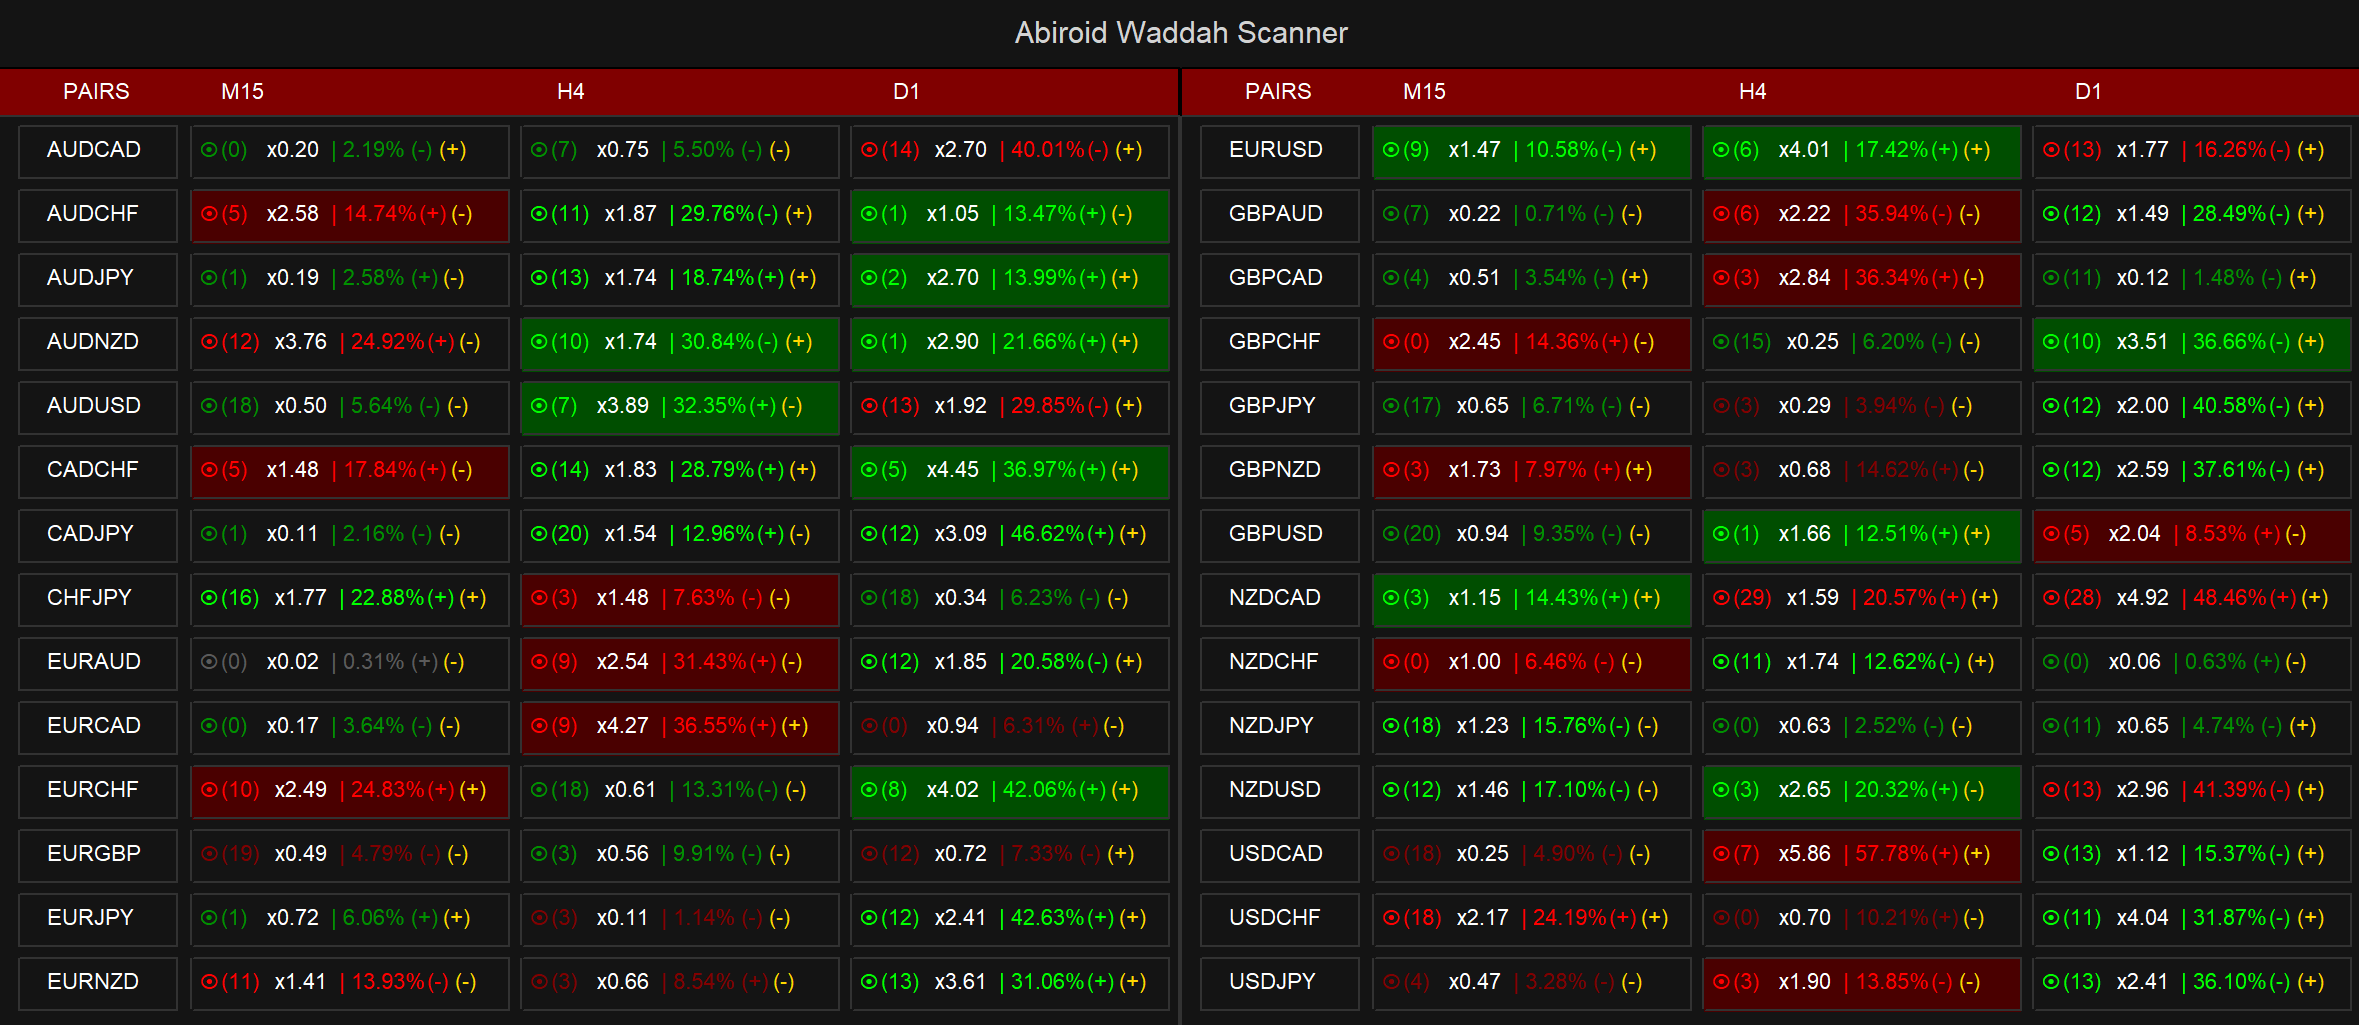
Waddah Scanner Dashboard (paid product):
If you are interested in a Scanner (Multi-timeframe and multi-currency) check out this product:
It contains many more features to find the best trades:
- Waddah Trend, Explosion Increase/Decrease
- Trend Percentage with Threshold
- Trend Direction Aligned Checks
- Highlight and Alerts
- Multi-Timeframe & Multi-Currency
https://abiroid.com/product/abiroid-waddah-scanner/
WAExplosion Explained:
https://abiroid.com/waddah-attar-explosion-for-scalping/
Components:
Trend:
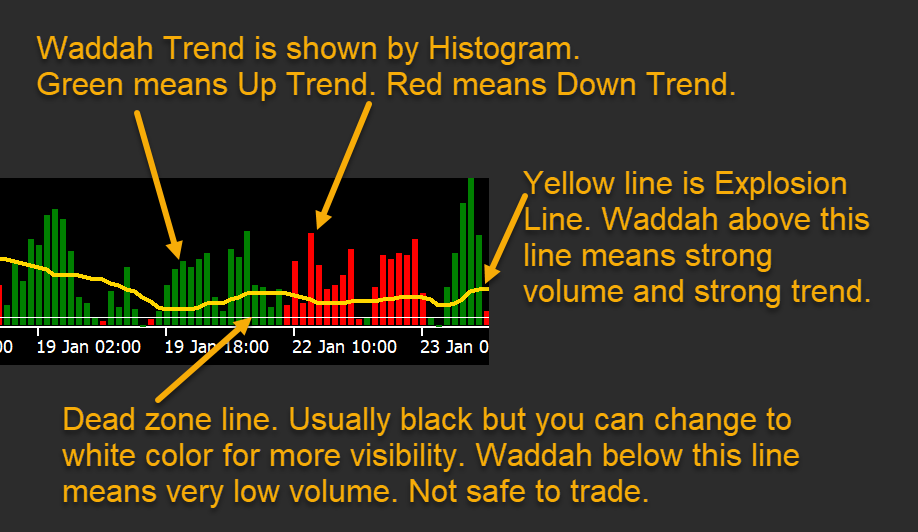
This is a histogram using red and green color lines. Red means Down trend and Green means Up trend.
Calculated using MACD trend difference between current and previous bar using “Sensetive” multiplier. “Sensetive” value adjusts the sensitivity of the overall indicator. Generally speaking, the smaller the time frame and/or slower the market and conversely, the larger the timeframe and/or market volatility, the higher the number. The typically accepted range is 75-150. Default is 150.
Explosion:
Yellow line is the explosion line. Also called Trigger Line. It is calculated using Bollinger bands upper and lower difference. Which gives best way to know when market is in low volatility or high volatility mode.
Dead Zone:
The white line in image. We can define any point value here. Any trend values below this line will be skipped. So good to find really high volume signals.
Multi-meter Symbols:
You can get 5 types of signals, depending on waddah values with respect to Explosion line or dead zone line.
And you can also set colors for each type of signal:
None will mean waddah is below deadzone. And so no signal.
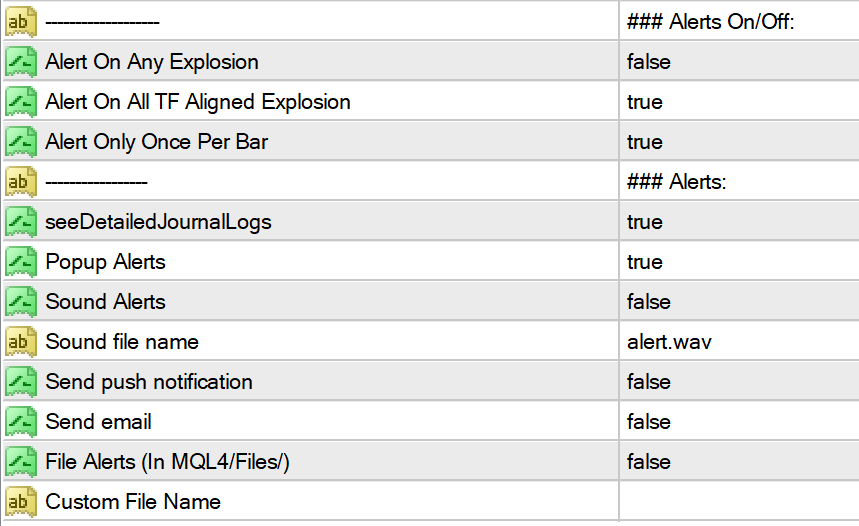
Alerts:
Alert on Any Explosion: Is for individual timeframe alert. And will occur when waddah goes above explosion line for any timeframe
Alert on All TF Aligned: Will happen if all timeframes have waddah above explosion line
Since Shift is 0, and bar is still forming, waddah might go above/below explosion line multiple times. So keep Alert Only once per bar to limit too many alerts.
Changelog:
v1.0 Base version
v1.3 Changed version number to match with Scanner’s version no. Because common libraries.
| mql_site_link |
|---|
Related products
Abiroid Quarters Scanner
Engulfing Candles Price Action
Abiroid Slope MA
Abiroid Fibo and Pivot Scanner with Missed Pivots
- Select separate Pivot Timeframes for each Dashboard Timeframe
- Check when price is near a Pivot point
- Check for Price Crossing Pivot Point
- Use Mid Pivots (Optional)
- Show Missed Pivots (Optional)
- Show High Volume Bar
- Use Fibo (Optional)
- Use Fibo Golden Ratio (Optional)
- Set your preferred Timeframe for Fibo or Pivots
TTM Waves ABC with BB Squeeze
ProfitPercent Arrows MA Confluence
- Main Signal Indicators (Any One): MA Cross (In-built) or Hull, OBV Cross, Heiken Ashi Cross
- Validation Indicators (Preferably less than 3): OBV (with Min Distance), Heiken Ashi, ADX, SuperTrend, PSAR, Higher TimeFrame EMA Alignment
- If MA Cross and OBV Cross both are false, only then Heiken Cross will be taken as Main Signal.


