TTM Waves ABC with BB Squeeze
30 $
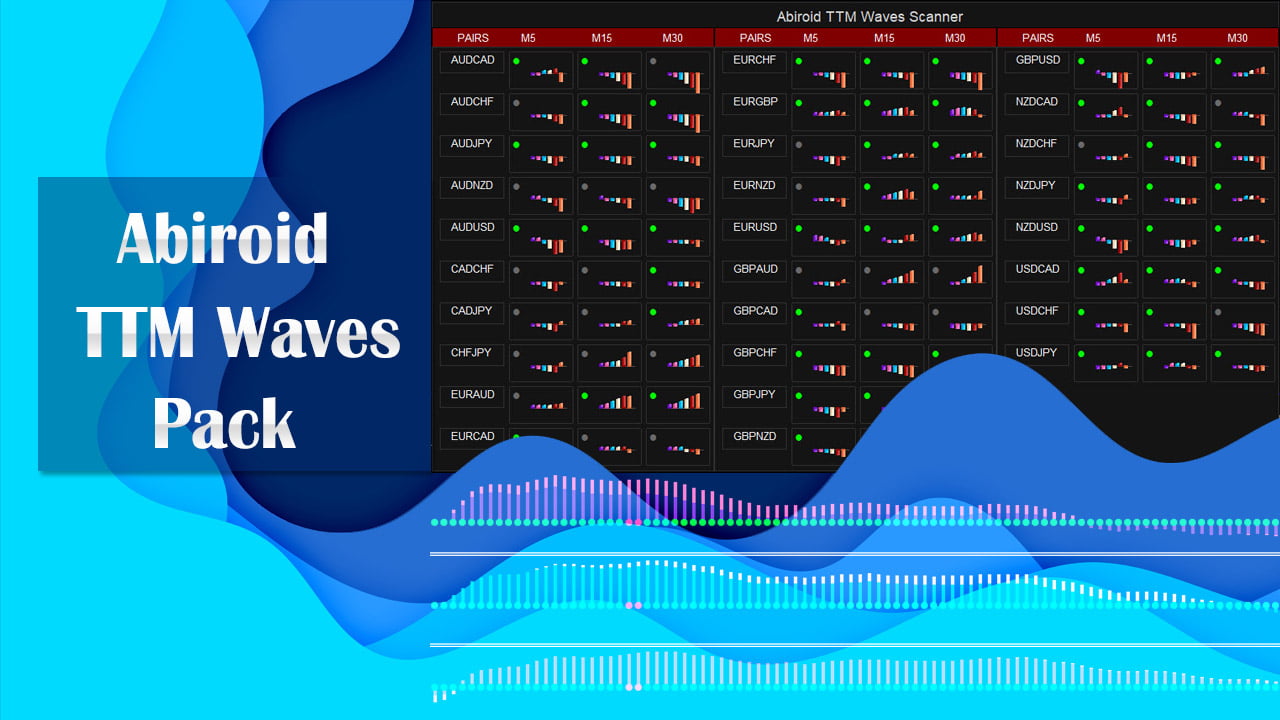
Coming soon on MQL5. Contact me.Download Pack contains 2 types of TTM Wave Indicators and a Scanner:
- 2 waves (and BB Squeeze)
- 3 waves (and BB Squeeze)
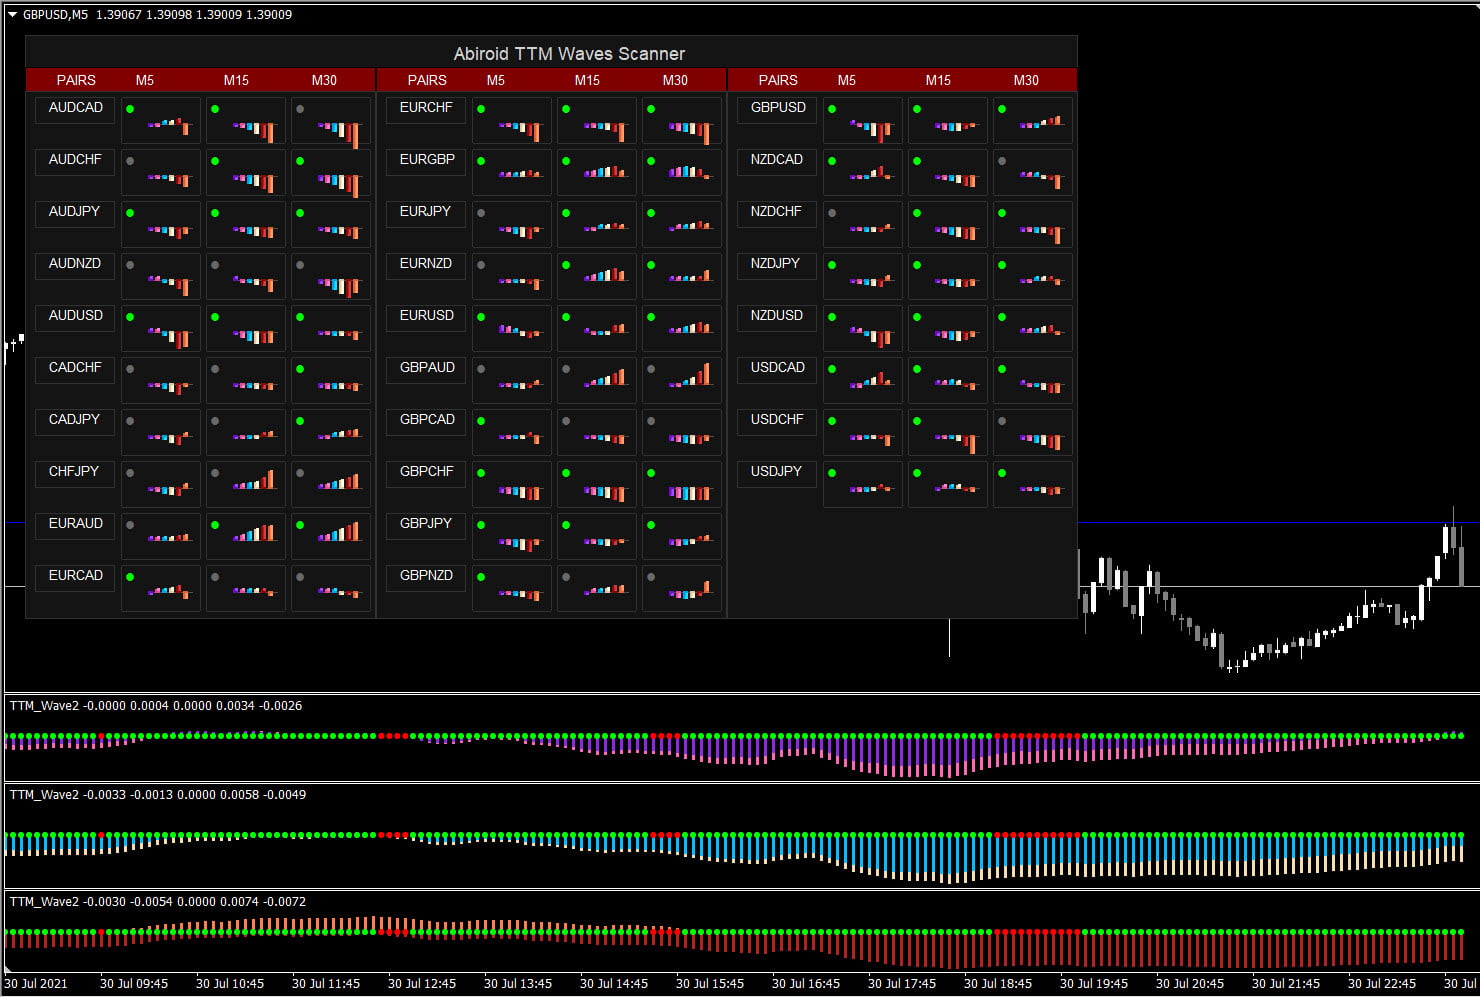
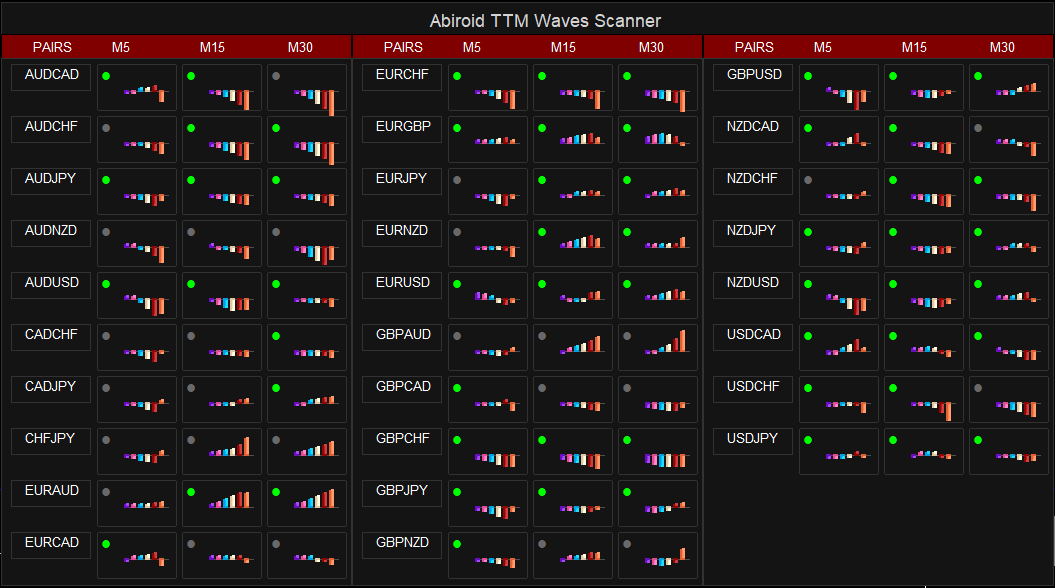
- Scanner Dashboard for multiple waves
Use these indicators to validate your existing TTM Waves strategy.
All products are non-refundable. Since these are digital products. No source code available, only executables. Please read product description carefully before buying.
This is a TTM ABC Waves scanner and waves Indicator for Metatrader 4 (MT4) platform.
Please try out the demo before buying.
Download Pack contains 2 types of TTM Wave Indicators and a Scanner:
- 2 waves (and BB Squeeze)
- 3 waves (and BB Squeeze)
- Scanner Dashboard for multiple waves
Use these indicators to validate your existing TTM Waves strategy.
Both 2waves and 3waves indicators are Multi-timeframe. So you can add as many as you like on chart and keep them for higher timeframes as well.
Scanner dashboard is Multi-timeframe and Multi-currency.
Free Demo:
Free waves demo works on AUDUSD,EURUSD,GBPUSD pairs. And scanner demo works for any 3 pairs.
Video Tutorial:
BBSqueeze:
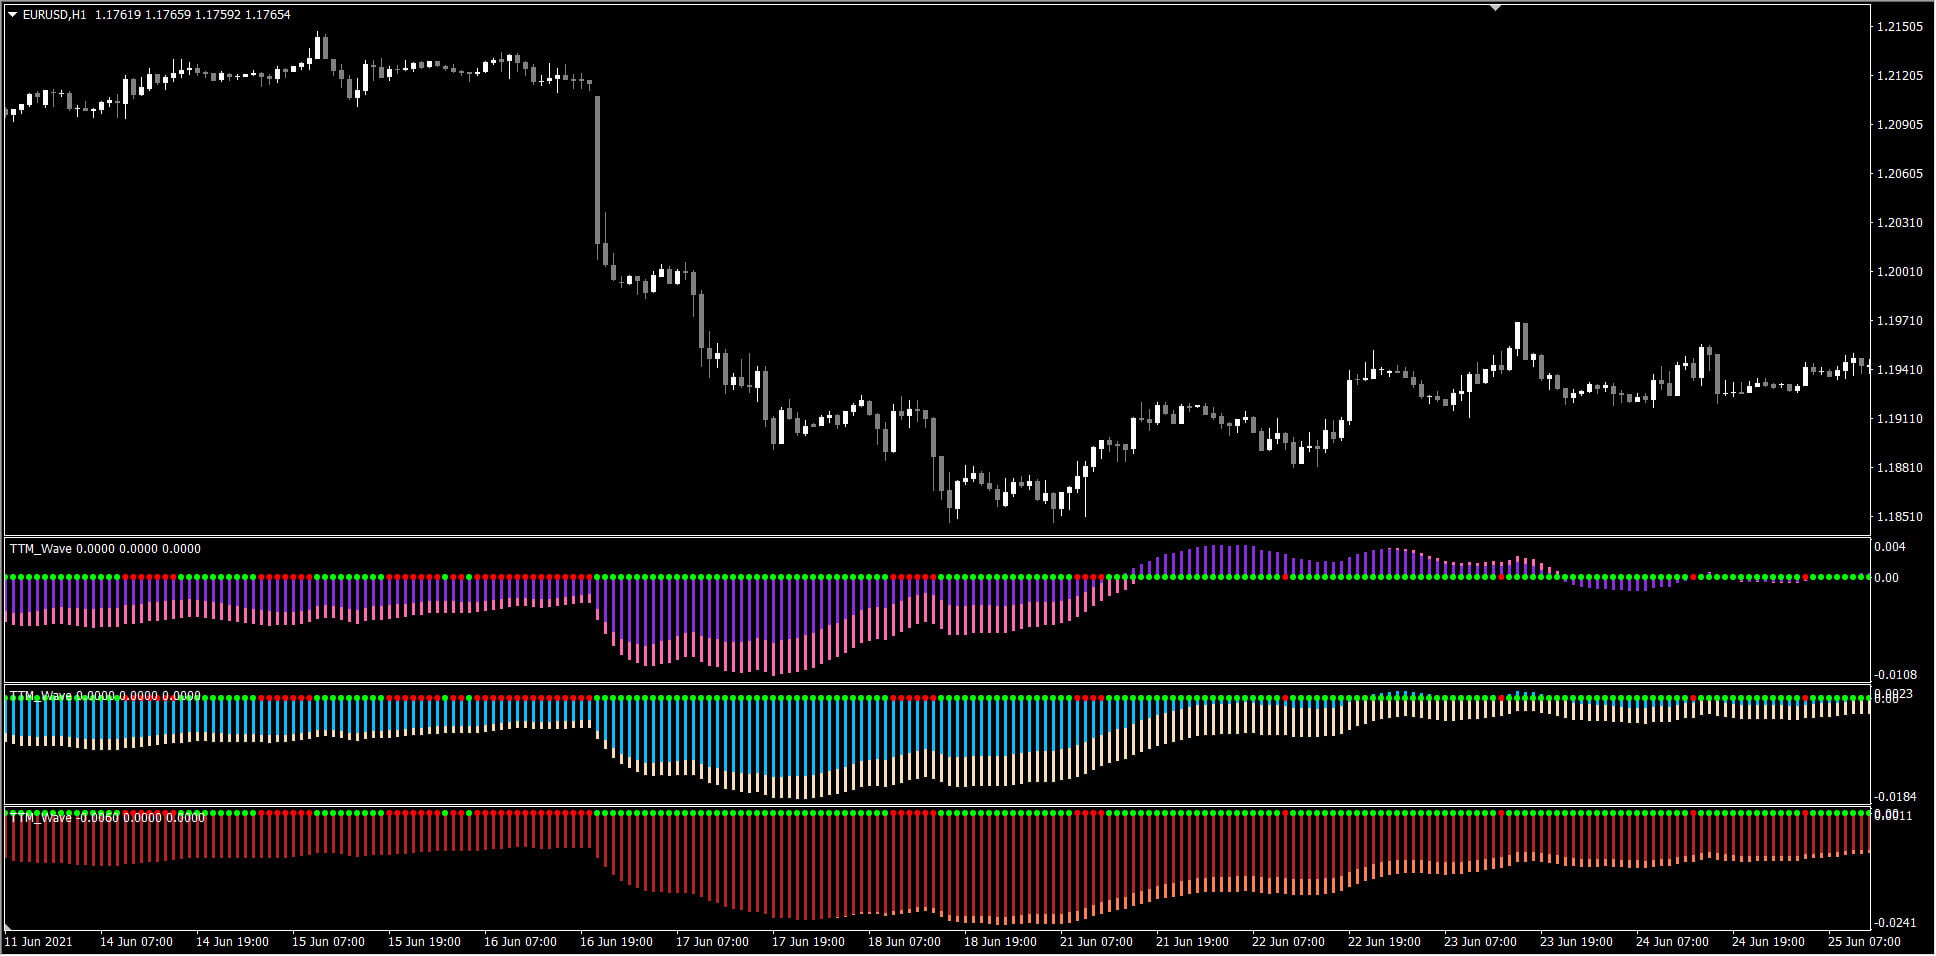
Red/Green dots in middle indicate BB Squeeze with Keltner channels.
Red means price is in a Bollonger bands squeeze. So don’t trade yet. Green indicates that squeeze is over and now trading is fine.
Because Bollinger bands have broken out of Keltner channels.
Use this as the TTM Squeeze indicator:
Please note that scanner is not for TTM Squeeze histogram. It’s for TTM Waves. And it only shows TTM Squeeze On/Off.
Example Use of ABC Waves with 2 Wave each:
Using 2-wave template:
In this template, you get 3 different indicators on chart:
- EMA Combination: 8 & 34 (A fast) and 8 & 55 (B slow)
- Next EMA Combination: 8 & 89 (A fast) and 8 & 144 (B slow)
- And EMA Combination: 8 & 233 (A fast) and 8 & 377 (B slow) with Wave 2 using only MACD
Best trends when all 3 histograms align.
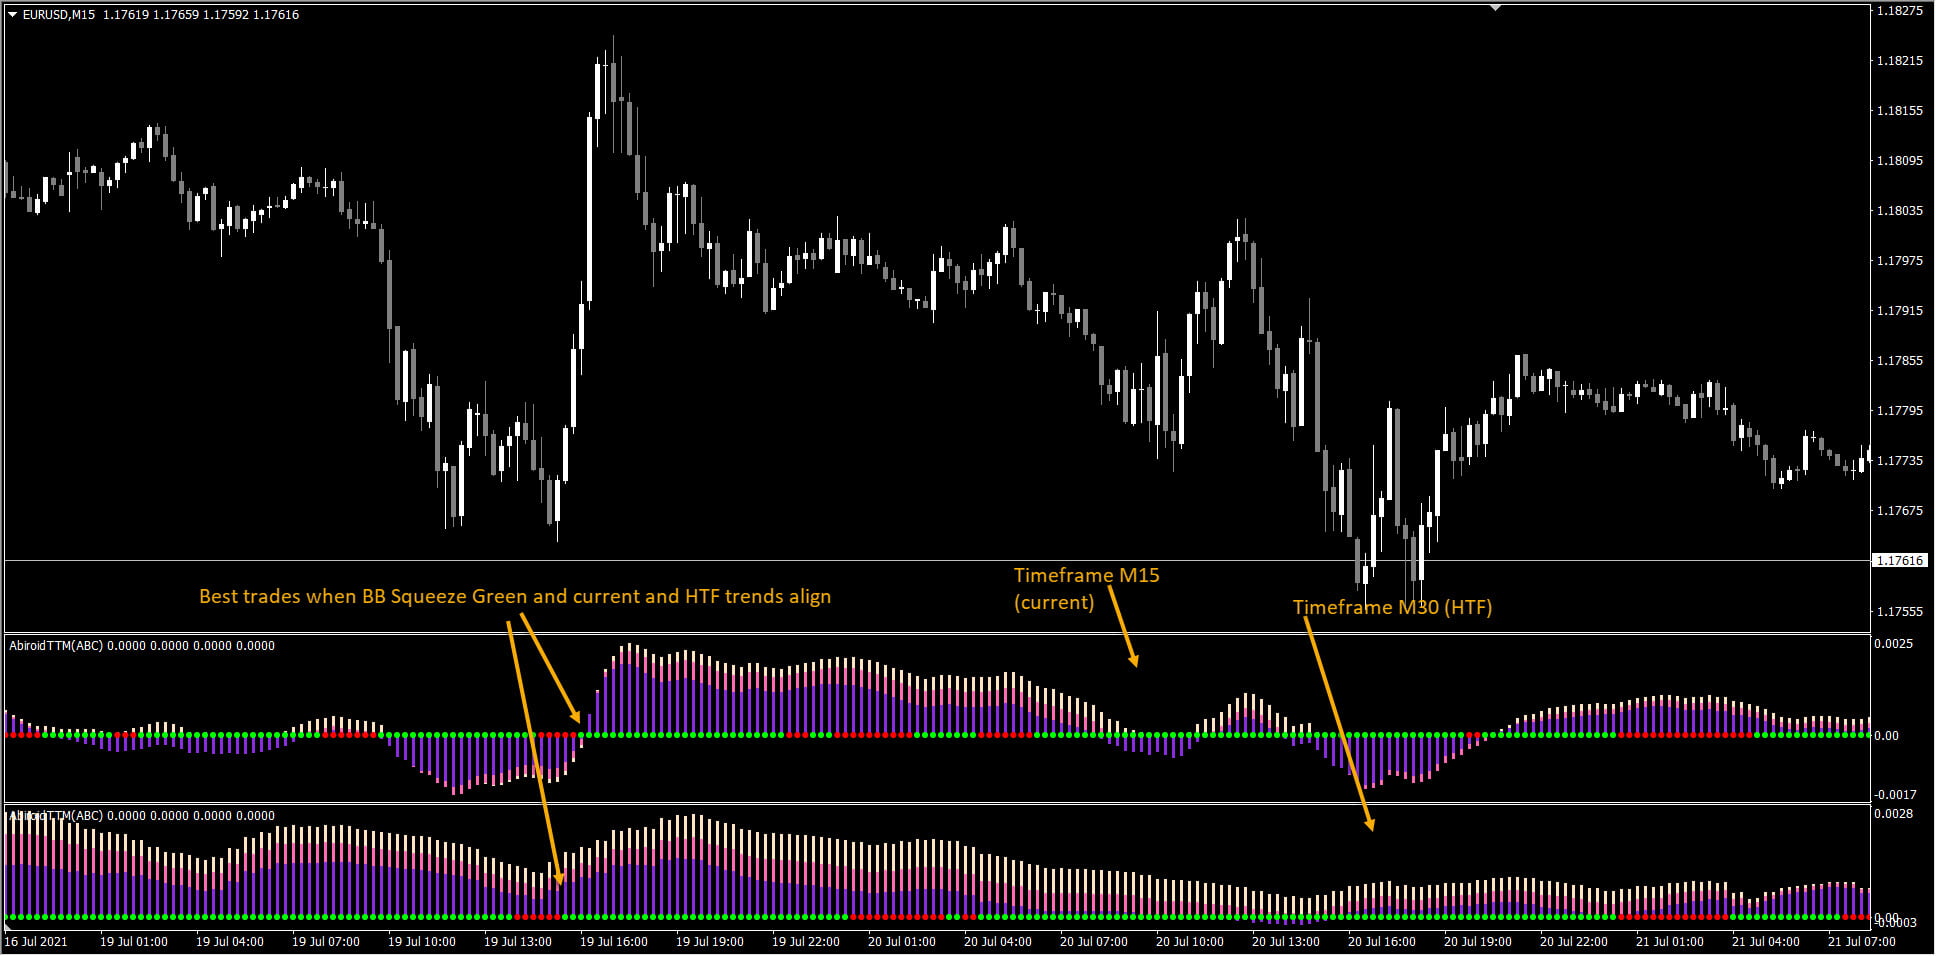
Example Use of 3-waves with HTF:
Using 3-wave template:
In this template, you get 2 different indicators on chart:
EMA Combination: 8, 34 (fast) and 8, 55 (medium) and 8, 89 (slow)
- For Current Timeframe
- For Higher Timeframe (if needed)
Best trends when all histograms align.
Wave Calculation and MACD Average:
By default, wave is calculated using Fast and Slow MA MACD difference. But you can average those values for a smoother wave.
Smoother wave might repaint values a bit because those will be re-calculated to smooth them.
Note: Indicators TTM 2Waves and TTM 3Waves don’t have any alerts. Only scanner has alerts because it looks for wave alignments.
Settings:
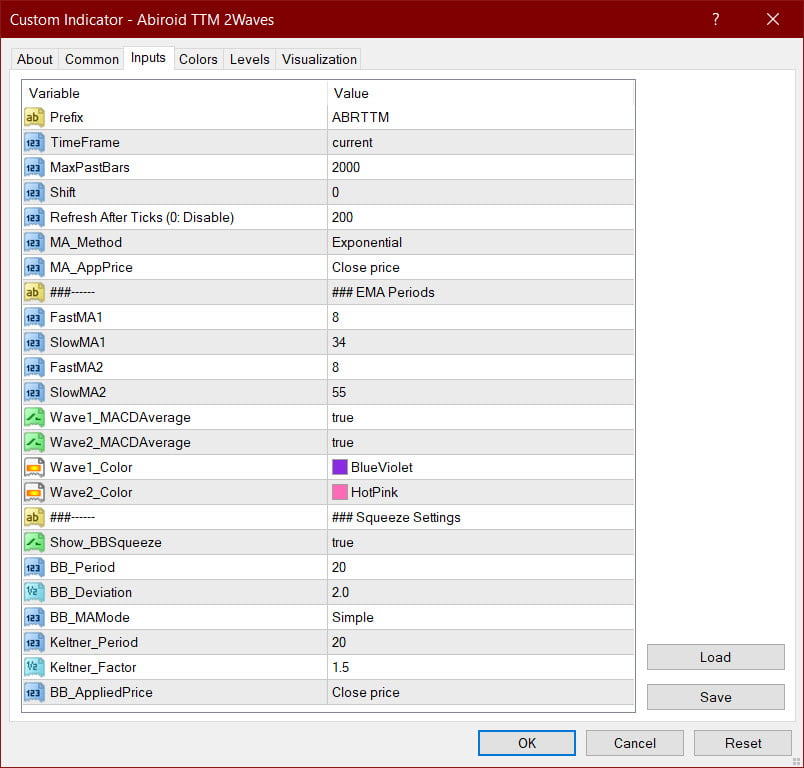
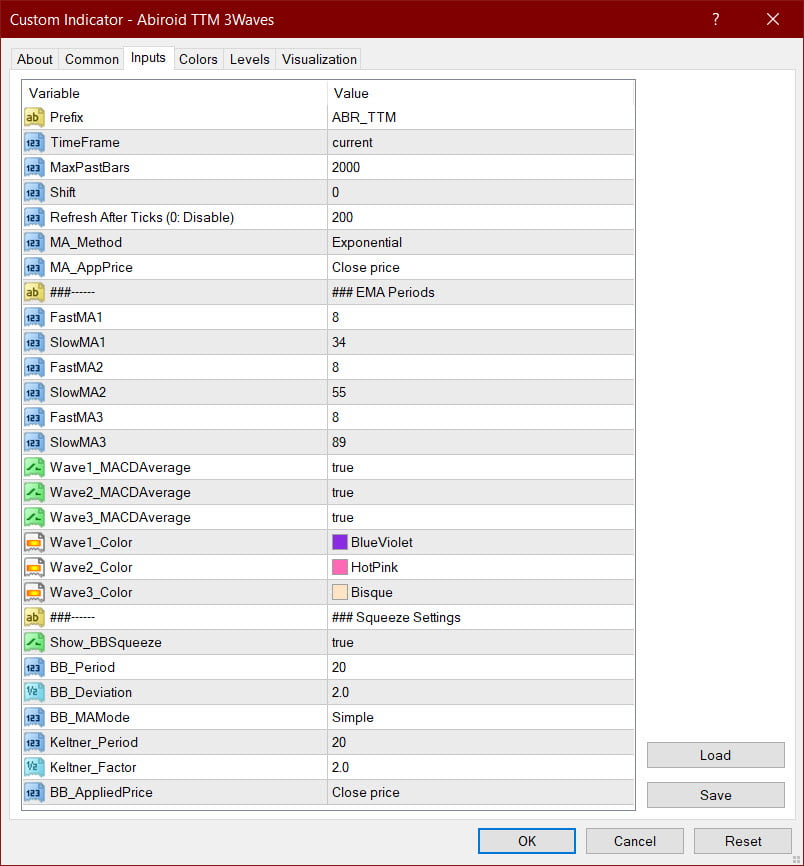
Settings for both 2 waves and 3 waves are exactly the same. The 3 waves just shows 1 more wave. And is very useful when showing multi-timeframe waves on same chart.
Refresh After Ticks: If Shift is 0 refresh every number of ticks. If “Refresh After Ticks” is 0 then refresh every new bar.
Use Shift bar to get that wave’s value for that bar.
Use MaxPastBars for total number of bars to be drawn.
Select Timeframe from drop-down. Default is current timeframe.
Scanner:
The scanner just shows the TTM Waves for all the Periods specified.
TTM Specific Scanner Settings:
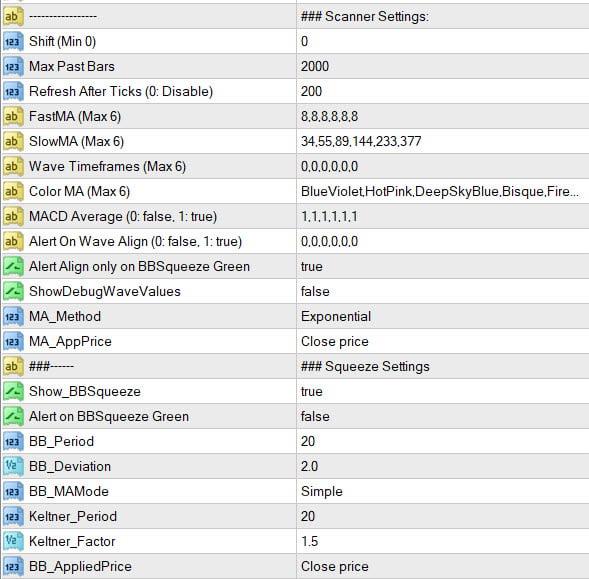
Periods:
Specify the Fast MA and Slow MA Periods as Comma-Separated values. Best to use maximum 6 values of less.
All other comma-separated values Correspond to Fast/Slow MA Periods.
Timeframes:
Wave Timeframes is for higher timeframes. Keep 0 for that column’s timeframe. But for custom timeframes use:
1,5,30,60,240,1440,10080,43200
or
M1,M5,M15,M30,H1,H4,D1,W1,MN1
Color:
Specify color values for histogram bars. Metatrader preset colors allowed.
MACD Average:
1 means true and 0 means false. See above section for MACD Average.
Alerts:
Get Alerts when waves align by specifying 1 or 0 values. 1 means true and 0 means false.
Also, get alerts for currency with BBSqueeze Green. Meaning no BB-Squeeze.
Common Scanner Settings:
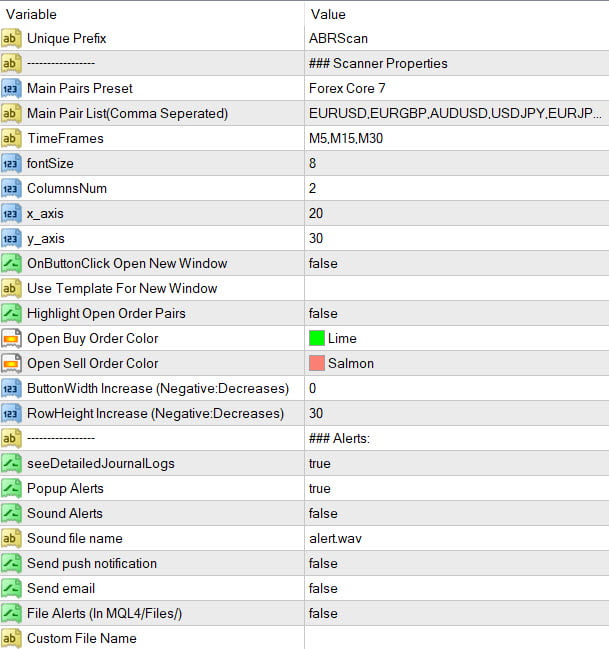
Check out this post for Scanner common settings:
https://abiroid.com/indicators/abiroid-scanner-dashboard-common-settings
Changelog:
v1.0 Base
v1.1 Fixed Incorrect HTF Values Bug. Because Higher timeframes have different Max Past Bars
Related products
Engulfing Candles Price Action
Darvas Box Strategy Arrows and Scanner
- Check Darvas Box Breakout
- Check Price Above/Below MA or Darvas Box has crossed MA
- NRTR Trend Check
- Heiken Trend Check
- MA Slope Check
- Higher Timeframes Price and MA check
- Fixed Stop Loss and Take Profit Option
- Variable Stop Loss at Darvas Box or Darvas Pivots or selected MA
- Calculation of Profit Loss Points and Win/Loss Count and Profit Percentage

