Trader’s Dynamic Index (TDI) Explained
What is TDI?
A hybrid indicator developed to indicate market conditions related to trend direction, momentum, and market volatility.
An “all-in-one” indicator representing Market Sentiment!
TDI Lines:
RSI Price Line (Green)
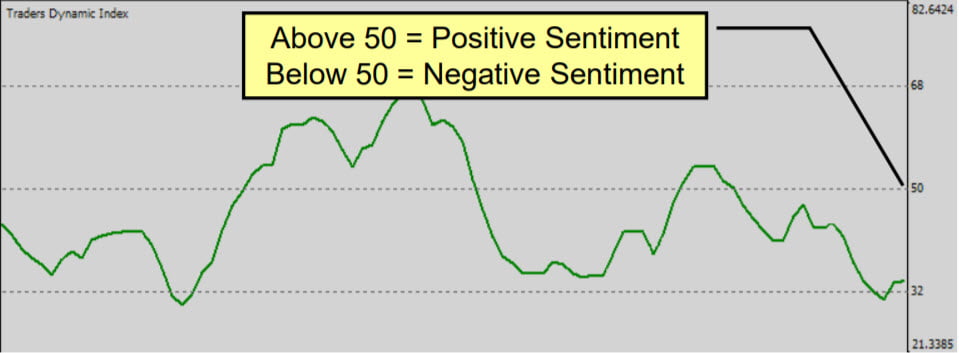
Green > 50 = Positive sentiment … (Buyers buying)
Green < 50 = Negative sentiment … (Sellers selling)
Trade Signal (Red) Line
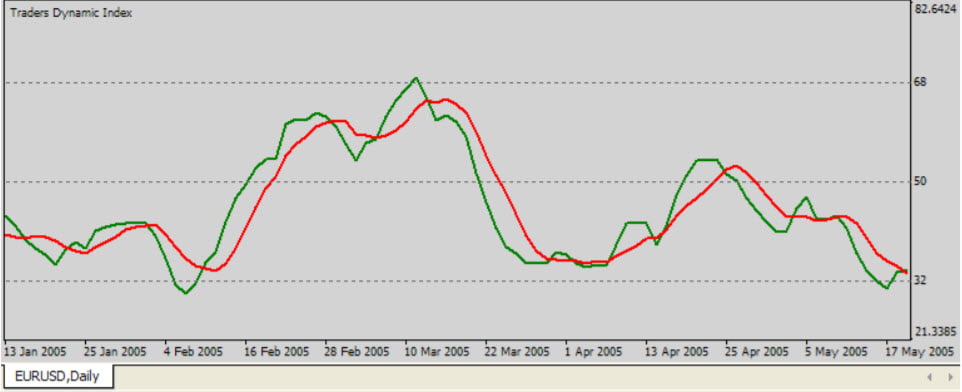
Rules: Trade Long when Green > Red.
Trade Short when Green < Red.
Exit trade when Green & Red crossover.
Market Base (Yellow) Line

Rules: Market Base Line (MBL) is the Overall Trend.
Trade Long when Green is > Yellow line.
Trade Short when Green is < Yellow line.
Volatility Band (Blue) Lines:

Possible to add to a Short when Possible to add to a Short when RSI PL is < VB.
Consider exit when Consider exit when RSI PL crosses back over crosses back over VB.
How Are the Lines Calculated?

RSI Price Line (Green Line)
RSI is the Relative Strength Index line calculated using the RSI Period. And Price Line is an SMA(2) of the RSI.
TSL (Red Line):
It is the Moving Average of past RSI values.
Volatility Bands (Blue):
MBL (Yellow Line):
TDI Line Colors:
Default Indicator SignalLevels:
Scanner Dashboard:
Check out the Dash:
How Signals in Scanner are calculated:
TDI Signals:
Strong Buy: PL>TRADE SIGNAL LINE AND TRADE SIGNAL LINE> MARKET BASE LINE AND PL>RSI_OversoldLevel AND PL<RSI_OverboughtLevel
Medium Buy: PL>TRADE SIGNAL LINE AND PL> MARKET BASE LINE AND TRADE SIGNAL LINE< MARKET BASE LINE AND PL>RSI_OversoldLevel AND RSI<RSI_OverboughtLevel
Weak Buy: PL>TRADE SIGNAL LINE AND TRADE SIGNAL LINE<MARKET BASE LINE AND PL< MARKET BASE LINE AND PL>RSI_OversoldLevel AND RSI<RSI_OverboughtLevel
Strong Sell: PL<TRADE SIGNAL LINE AND TRADE SIGNAL LINE< MARKET BASE LINE AND PL>RSI_OversoldLevel AND PL<RSI_OverboughtLevel
Medium Sell: PL<TRADE SIGNAL LINE AND PL< MARKET BASE LINE AND TRADE SIGNAL LINE> MARKET BASE LINE AND PL>RSI_OversoldLevel AND RSI<RSI_OverboughtLevel
Weak Sell: PL<TRADE SIGNAL LINE AND TRADE SIGNAL LINE> MARKET BASE LINE AND PL> MARKET BASE LINE AND PL>RSI_OversoldLevel AND RSI<RSI_OverboughtLevel
HIGH LEVEL CAUTION (Overbought): PL>=RSI_OverboughtLevel
LOW LEVEL CAUTION (Oversold): PL<=RSI_OversoldLevel
TDI Trend:
Strong Up: TRADE SIGNAL LINE>MARKET BASE LINE
Weak Up: TRADE SIGNAL LINE>MARKET BASE LINE AND PL<MARKET BASE LINE
Strong Down: TRADE SIGNAL LINE<=MARKET BASE LINE
Weak Down: TRADE SIGNAL LINE<=MARKET BASE LINE AND PL>=MARKET BASE LINE
Consolidation: VB HIGH-VB LOW<VB_ConsolidationLevel
