Ichimoku Scanner Trading Strategies

Ichimoku Scanner Dashboard is great for finding good Up/Down Trends based on your own Ichimoku Strategies.
https://abiroid.com/product/ichimoku-scanner-dashboard
But here is a guide which will help you form good strategies.
Ichimoku Scanner:
Buy/Sell:
Buy and Sell Buttons mean that a Buy (Up) Trend or a Sell (Down) Trend has started. But always check the charts manually before placing a trade.
B-Zone and S-Zone means that price is continuing the Up or Down trend. As all conditions still match.
Before Starting This Guide:
If you are not familiar with Ichimoku terms and the overall indicator concepts, then please first study each Ichimoku Component:
Kumo Cloud, Tenkan, Kijun, Chikou. And what each line indicates. Kumo cloud acts like a Support/Resistance area also. And price always retraces back to it and crosses it when trend changes.
Use a site like this to read about it in detail:
https://tradingstrategyguides.com/best-ichimoku-strategy/
Avoid Markets:
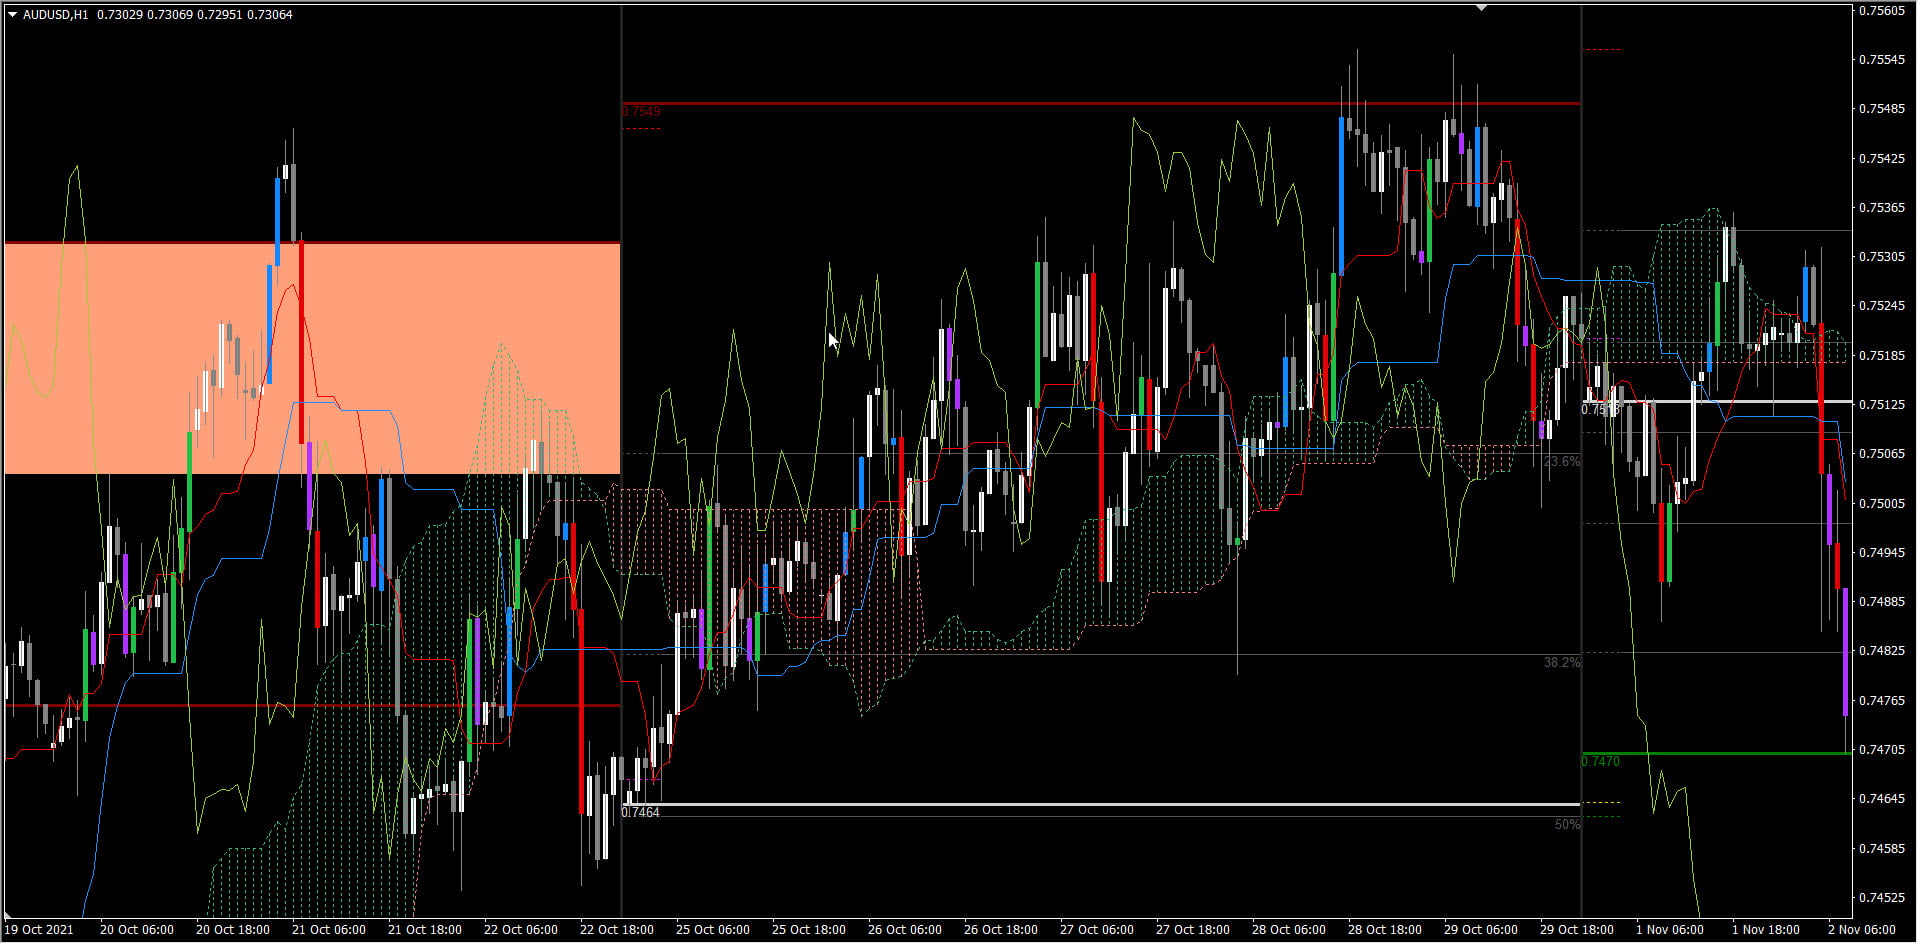
Since Ichimoku is a Trend based Indicator, only use when market has good volatility. Avoid slow/dead markets like this:

Use a site like this one to check which market is open. And then decide which pairs are best to trade.
http://forex.timezoneconverter.com/
Also avoid choppy markets, like during news events when price seems to be going up/down in a whipsawing way.
It’s dangerous to trade as no clear trend will be there:
Study past bars to see how the trading pair is behaving. So, it’s very important to use this scanner manually after studying the charts.
Strategy 1: Ichimoku Kumo & Pivots:
This is suitable for scalping and long term trading on at least M15+
Use Pivot Indicator:
For M15,M30 use Daily Pivots. And for H1 use Daily or Weekly pivots (whichever suits you). For H4 use Weekly. And for W1 use Monthly.
Since monthly is last chart, there is no suitable pivots timeframe for that. You can also use Fibo levels if you are familiar with Fibonacci.
Use Volume Indicator:
Ichimoku Indicator is Inbuilt into MT4:
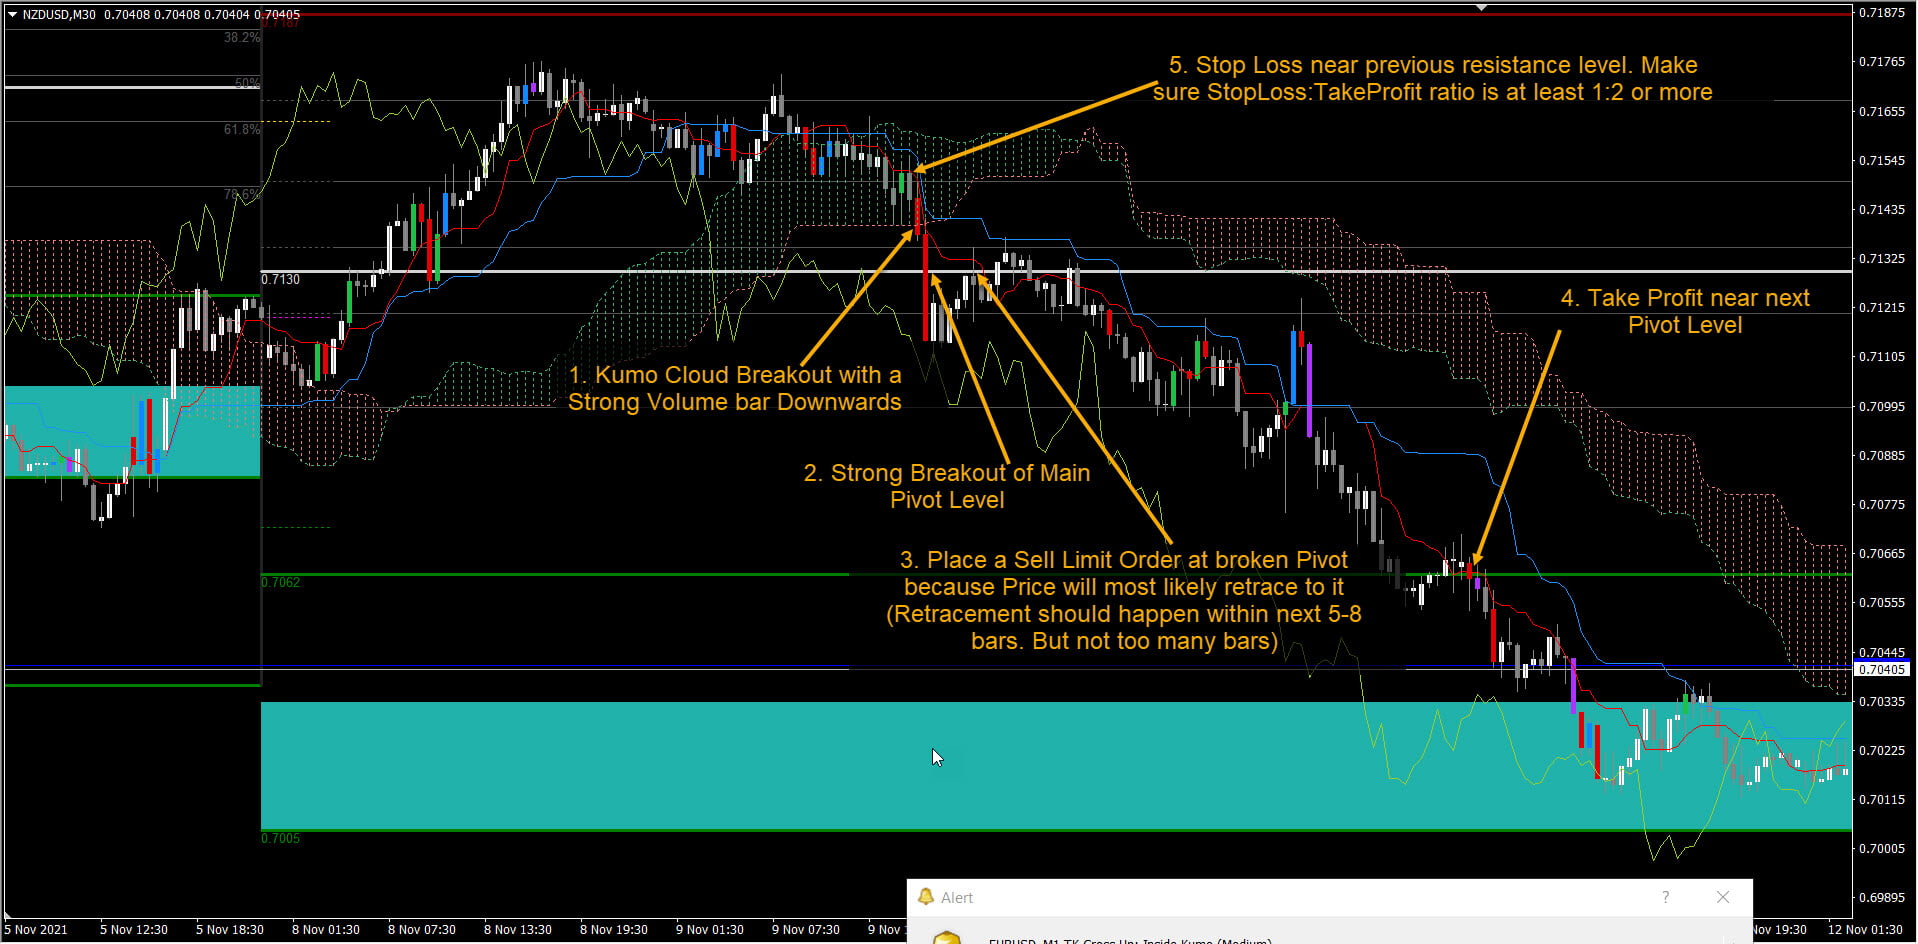
Above example is for SELL. Use same conditions for BUY reversed.
- Wait for a Kumo Cloud breakout. In scanner, only keep Kumo Cloud check true. Keep all other checks false.
- If you like to use Tenkan-Kijun check, it will give even better trends but fewer signals.
- Next wait for a high Volume Bar which crosses Kumo.
- Check how far the price is from next Pivot. If price has also crossed a Pivot level (not mid-pivots), then wait for price to retrace back to Pivot level.
- So, you can either keep a Buy/Sell Limit order with 2-3 bars expiry. Or wait for price to retrace back to Pivot and do a Buy/Sell
- Keep very close stop loss. And keep take profit at the nearest SR level that you can see. Study the past bars a little. In most cases it is near the next Pivot or next Fibo level.
See the above diagram for Stops.
Strategy 2: Ichimoku Kumo & Tenkan-Kijun & SR:
This is suitable for longer term trend trading. On at least H1+
Use SR Indicator:
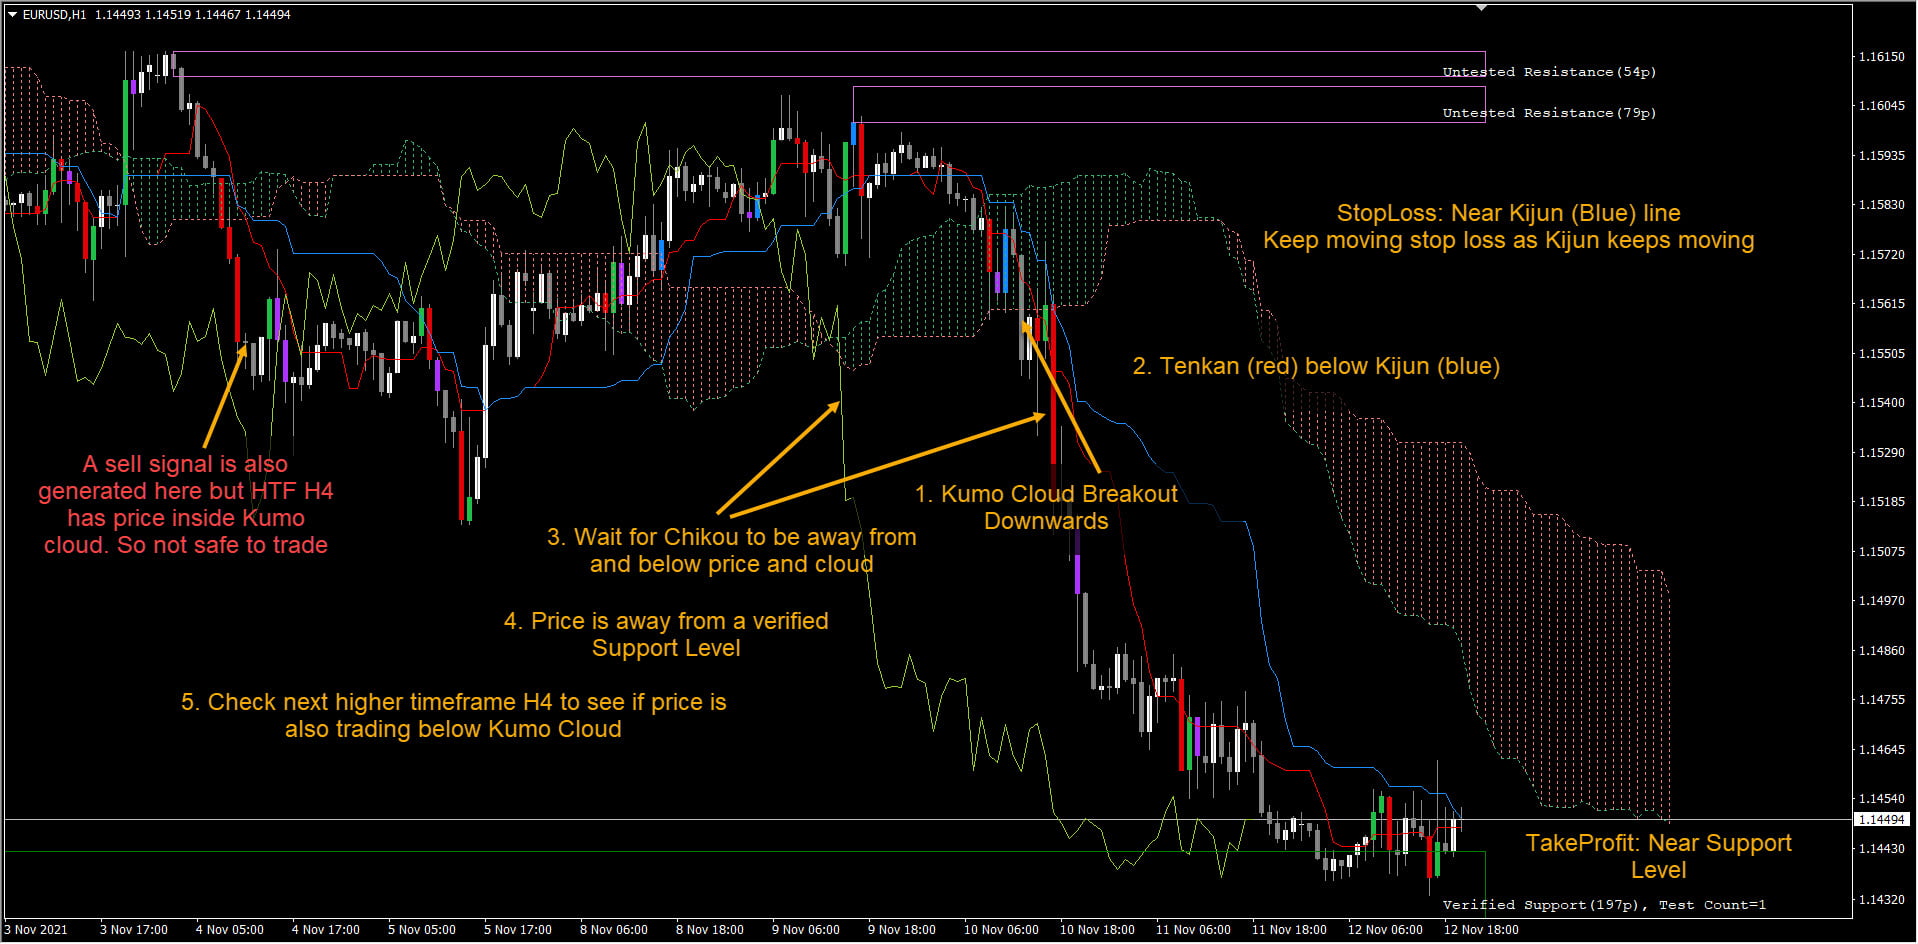
- Kumo Cloud Breakout Up/Down
- Tenkan above Kijun for Buy and below Kijun for Sell
- Wait for Chikou to go away from Kumo cloud and Price. Chikou should be above Kumo for Buy and below Kumo for Sell.
- Make sure price is away from any Resistance levels (for buy) Support levels (for Sell). You can also use Pivots here if you like.
- Check higher timeframes and make sure price is along Ichimoku trend. Meaning price is above Kumo for Buy and below Kumo for Sell.
See the above diagram for Stops.
I will keep updating this post with more Ichimoku Strategies.