


Ichimoku Scanner Dashboard
65 $
Buy from MQL5- Price Kumo Breakout
- Tenkan-Kijun Cross
- Chikou/CLoud and Chikou/Price
- Support/Resistance (SR-SS or SR-NRTR)
- Stochastic OB/OS and back
- Awesome Oscillator
- Higher Timeframe Ichimoku Trend Align
All products are non-refundable. Since these are digital products. No source code available, only executables. Please read product description carefully before buying.
Ichimoku Strategies Guide:
https://abiroid.com/explained/ichimoku-scanner-trading-strategies
Download Demo:
Note: Demo only works for 3 pairs
This post contains the extra Metatrader 4 indicators for mql5.com Market product:
Ichimoku Scanner Dashboard
available here:
https://www.mql5.com/en/market/product/41711
Try demo:
Demo works for 3 pairs. And contains all functionality of the actual scanner. So you can try it before buying 🙂
Additional indicators/template:
To use Ichimoku.tpl file, in Dashboard properties: “Use Template For New Window”: Ichimoku
NRTR For Chart:
Please note:
I won’t be able to add new settings. It already has 72 settings 🙂
Some people are using it with their EAs. And iCustom function can only take Max 64 settings.
So, I cannot let it grow any further.
I’ll definitely be maintaining the code and solving issues. Don’t worry 🙂
Please check all settings in demo strategy tester before buying.
Product Description:
Dashboard uses Ichimoku Strategy to find best trades.
Use this template: specify “Ichimoku” in Property: “Use Template For New Window”
Tutorial:
Default strategy:
Checks:
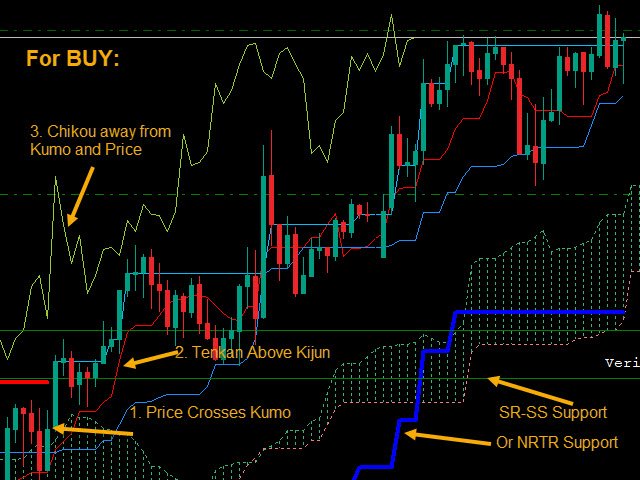
For BUY:
* If “Check Price Kumo Breakout” true and price above at least min distance from Kumo
* If “Check Tenkan Kijun Cross” true and Tenkan at least min distance above Kijun
Check all Tenkan/Kijun Filters in Filter 1 and Filter 2
* If “Check Chikou Cloud Distance” true and Chikou at least min distance away from Kumo
* If “Check Support/Resistance”: SR-SS uses SS_SupportResistance_v07.53.ex4 and price at least min distance away from Resistance
SR-NRTR uses NRTR_Rosh_v2eAlert_mtf.ex4 and price above blue Support
* If “Use Stochastic” true and price within safe Stochastic Overbought/Oversold
* If “Only when Overbought/Sold and back” true then also check if price was Oversold and back in previous bar.
* If “Use Awesome Oscillator” true then check Awesome is above and Green.
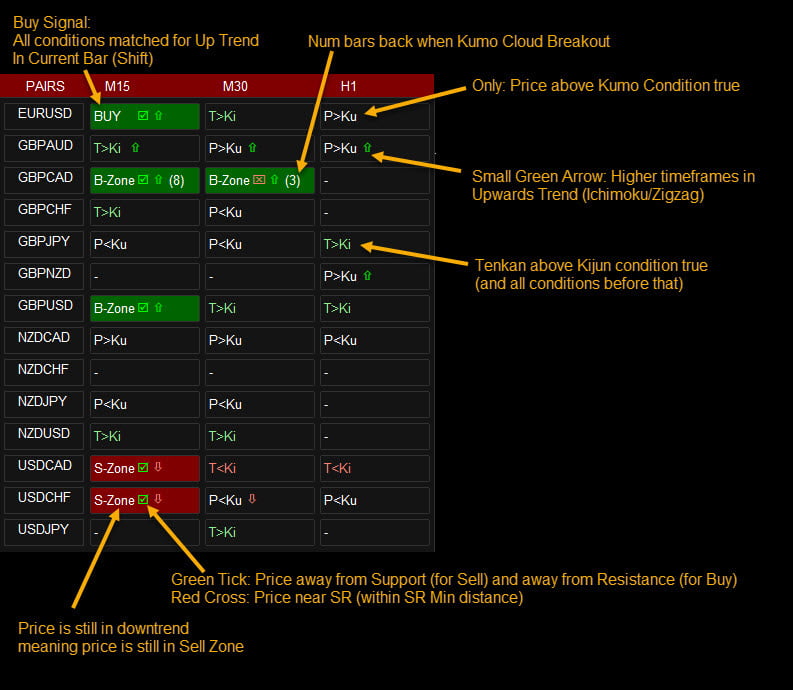
If all above conditions are met, you will get a BUY Signal. For SELL vice-versa
And while trend is good, it shows B-Zone/S-Zone.
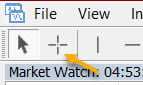
Min Distance Calculation:
All Min Distance calculation is in points. Find the Min Distance using the crosshairs tool:
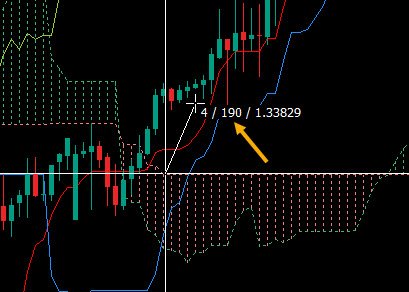
Here middle value 190 is distance in points.
So suppose you are using timeframes M15,M30,H1
And you keep “Min Price-Cloud Distance” values 40,80,160
Then it will check on M15 that price is at least 40 points above Kumo for Buy and 40 points below Kumo for Sell.
And for M30, it will check 80 points above/below and for H1 160 points above/below.
Same way you can set other Min Distances as 40,80,160 or whatever values you like based on the Min distance you prefer on that timeframe.
S/R Calculation:
It uses: “SS_SupportResistance_v07.53” indicator to calculate SR Lines. Available as extras in link above.
Ichimoku Dash keeps show_zone_turncoat to false in “SS_SupportResistance_v07.53”:
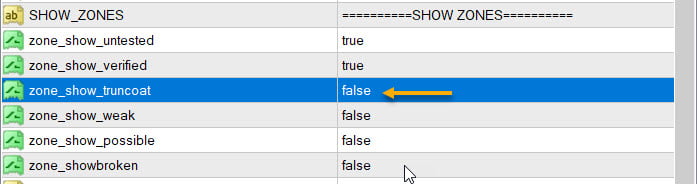
About Turncoat zones: If Support was brokern it will show as turned resistance-zone. Same way if a Resistance is broken it will show as Support.
And Turncoat Zones are not very reliable, and there will be too many of them, so we keep them off.
* If “Check Support/Resistance” true
For BUY Check price distance from Resistance. And for SELL check price distance from Support.
Using the “Min Distance From S/R” values. If Min Distance values are blank, then it will check if price is inside SR Zone or not.
If Min Distance is specified, then it will check if price is at least Min Distance away from center of SR Zone or not.
If safe to trade, show a Green Tick in the BUY/SELL buttons. Else show a Red Cross.
So, if your timeframes are M5,M15,M30 and the “Min Distance From S/R” values are 10,20,30.
Then for BUY for M5, check if price is at least 10 points away from Resistance.
(e.g. for EURUSD if resistance is at 1.10050, then price should be at least below 1.10040).
* If “Only Alerts When Safe S/R” true get Alerts for only Safe trades.
Ignore alerts for other trades where price too close to Resistance (for BUY) or Support (for SELL)
(Note: Only alerts ignored. BUY/SELL buttons will still light up with green/red ticks)
For NRTR: For Buy price should be above blue support and For Sell price should be below red resistance. Min distances are not relevant here.
Higher Timeframe Alignment Check:
Force Align Check True: looks at higher timeframes to see if Trend is aligned with current timeframe’s trend or not.
Choices:
1. Ichimoku
If using Ichimoku, it will check if HTF timeframes also have price above Kumo for Buy and below Kumo for Sell.
E.g. if current TF is M30 and has a BUY Signal (price above Kumo and all other checks satisfied)
And “Number of higher TF Check for Trend Align” is 2, then it will check if H1 and H4 both also have price above Kumo (not necessarily Min Distance away).
HTF Alignment check only checks if price above Kumo for BUY and below for SELL on HTF. And won’t look for other checks (TK, Chikou, etc) on HTF. Because otherwise signals will be too limited.
So, it helps you trade only when higher timeframes are also in the same direction trend.
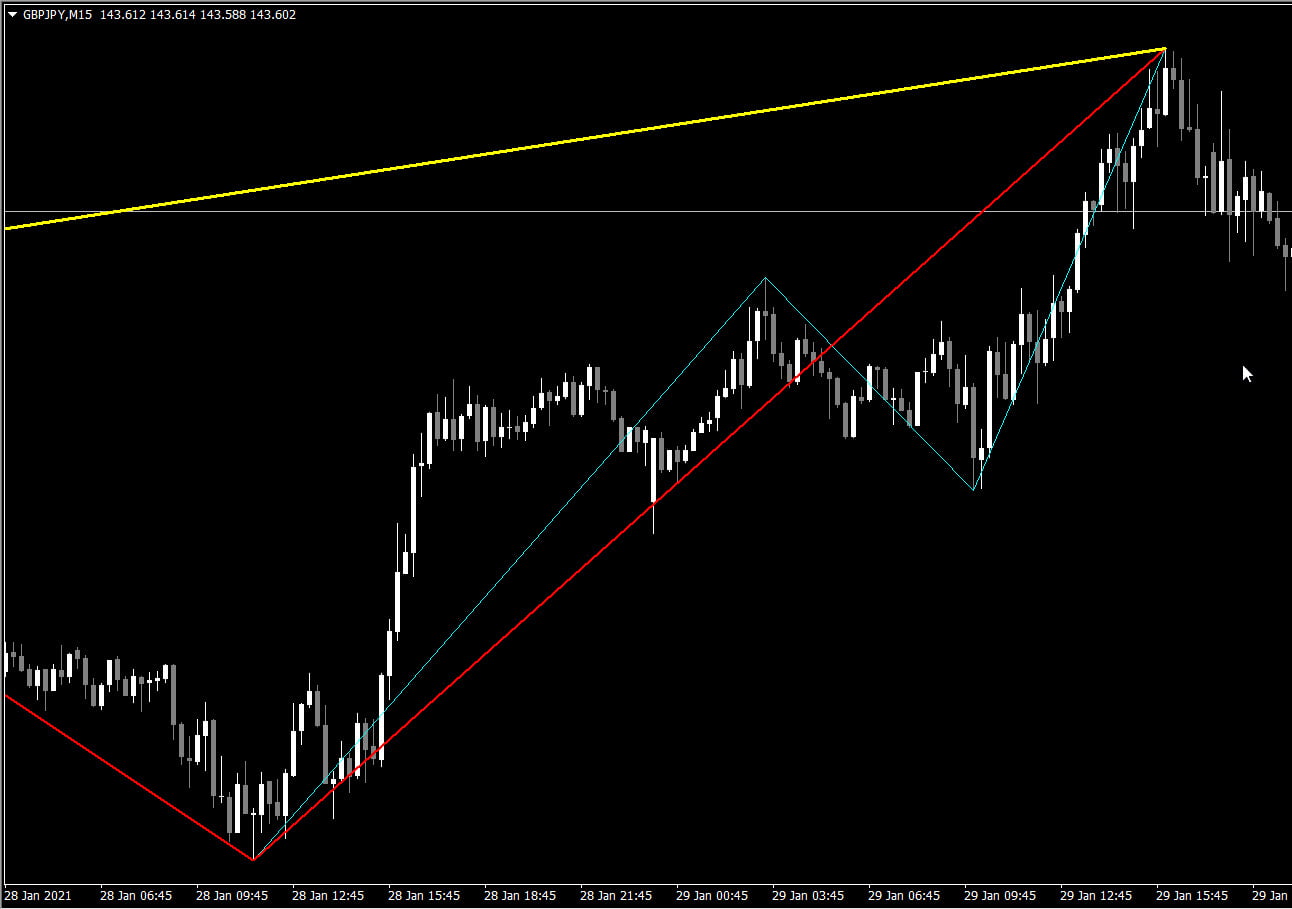
2. Zigzag
If using Zigzag, it will check all HTF timeframes for Zigzag trend. Use this multiTF zigzag tool to see zigzag for multiple timeframes:
E.g:
Blue line is M30, Red line is H1 and Yellow line is H4. And all lines create a zigzag point at the top high. Indicating price will now reverse downwards.
So they signify a down trend and if Ichimoku on M15 (current TF) also indicates Down trend, then you will get a SELL signal.
Zigzag check is very useful for short scalping in smaller timeframes. You could keep looking for Kumo breakouts and always trade in direction of trend according to higher timeframes.
And keep all other checks like Chikou, TK Checks, stochastic, etc false. To get quicker signals.
– Own Pairs List or Select pairs list from drop-down like “Forex Core 7”, “Forex Core 14”, etc.
– Time frames. Possible values: M1,M5,M15,M30,H1,H4,D1,W1,MN1
– Min Distances: 30,40,50
(Converted to points. Eg for H1 EURJPY: if kumo is at 116.800. And this value is 50. It will check if price is at least above 116.850)
– Settings for showing alerts: Popup, email, sound alerts, etc.
– x_axis, y_axis: to position Scanner Dashboard
– fontSize: resize whole panel and fonts. Use fontSize between 5 and 8.
– ColumnsNum: No of Dashboard Columns
– OnButtonClick Open New Window: On clicking any button open that Pair-TimeFrame in a new window with your template:
– Use Template for New Window: Template name without “.tpl”. Eg: Create a file Template1.tpl in templates folder and here specify: “Template1”.
(only works if previous property set to true). Does not work if on button click is set to open in current window.
– Shift: Bar for which all conditions are checked. Candle Shift 0 means current bar (still forming). Candle Shift 1 means last closed bar. And so on…
– Refresh After Ticks (if shift 0): For shift 0 (current candle), wait for this number of ticks before refreshing everytime.
If using higher timeframes use a much higher number like 300 or 500.
– Use Heiken Ashi Price: If true Use Heiken-Ashi bar close price instead of actual bar close.
– Use Stochastic: If true use stochastic indicator to find good BUY/SELL.
If “Only when Overbought/Sold and back” true: Good BUY if Stochastic went Oversold below 80 and back. Good SELL if went OverBought and back.
– Check Price Kumo Breakout: If true check when price breaks Kumo cloud. Upwards means Up trend and Downwards break means downtrend has started
Show Kumo Breakout Past Bars (x): Will show how many bars back the Kumo cloud break happened. When Buy/Sell or B-Zone/S-Zone signal is On.
Keep this to 0 to turn this check off.
– Min Price-Cloud Distance: Minimum distance between price and Kumo Cloud.
– Max Tenkan Price Distance (comma separated): Maximum Distance in points between Tenkan and Price. If 0 then no check done.
– Tenkan and Kijun Filters with respect to Cloud:
– Strong Signal: Above/Below: Above for BUY and Below for SELL.
– Medium Signal: Above/Below Above or Inside for BUY and Below or Inside for SELL.
– Weak Signal: Anywhere
– With Price: Price Above/Below Tenkan Line or Kijun Line
– Check Tenkan Kijun Cross: true/false
– Min Tenkan Kijun Distance: If above true then check this Min distance between Tenkan and Kijun.
– Check Chikou Span: true/false
– Min Chikou Distance: If above true then check this Min distance between Chikou and Kumo or Chikou and Price.
– Alert On TK Cross: true: Alert when T & K cross and also show if cross happens above,below or inside Kumo.
For BUY TK Cross Strength:
TK Cross Up: Above Kumo (Strong)
TK Cross Up: Inside Kumo (Medium)
TK Cross Up: Below Kumo (Weak)
Filter On: True means only show Alerts for Medium and Strong TK Cross. Ignore weak signals.
How to Trade:
Best way to use this indicator is with Support and Resistance or TDI Indicator. Or any other indicator which validates strong trend and price is not near an SR Zone.
In general, set Stop-Loss near the Blue Kijun Sen (Base Line). Or use NRTR Support/Resistance for StopLoss.
Set Take Profit near SR line. Or wait for Stochastic to show that signal is oversold/overbought and possibly reversing.
You can also use TK cross in opposite direction as a Closing Trade signal.
Read about basic Ichimoku Strategies here:
| mql_site_link |
|---|


Hello , i have rent your Ichimoku Scanner for 1 month buy 10$ ,and download the file but not found Ichimoku Scanner indicator !!!!
only found template, AND SUPPORT INDICATOR WITCH IS I DO NOT WANT IT , please i need Ichimoku Scanner , waiting your replay.
Hi,
These extras files are free for download.
The paid system is on mql5.com Purchased section.
I see in the messages that you got it installed. I’m glad 🙂
Have you tried this with Renko charts?
Hi John,
Sorry. Haven’t tried with Renko charts.
Actually Ichimoku dash now has quite a few features and has started slowing down for too many pairs like 28-pair lists.
So, I’m reluctant adding any new indicators to it.
Thanks. This is only the first day of setting the panel up. So still learning how best to use it.
Hope you enjoy using it 🙂
If you ever need any help send me a PM on mql5.com site.
I try and remain very active on that site.
I would love to chat on MQL5 but for reasons yet to be explained to me, they have blocked me. I have repeatedly for their reason for this but they just refuse to reply to my messages. Which now means (I have told this) that I am unable to leave positive reviews.
Hi I just purchase your Ichimoku scanner from MQL5. I have hard time install. It give me a script error. Here is my order number: <deleted for privacy>.
Can you help me to install
Thank you
Hi Richard,
I just sent you an email.
Can you please tell me the script error you are getting?
Are you able to see it in your Purchased Section in Metatrader 4 app’s Market -> Purchased section?
Send me a screenshot of the error in an email and I’ll do my best to help you.
Regards,
-Abir.
Hi Abir,
Is it possible to build one more check in it: Tenkan / Price max distance?
That completes my strategy, the reason I am asking.
Regards,
Gokhan
Hi,
I replied to your PM on mql5 site.
Hello Abir,
I would like to know, will the ichimuko scanner works for Indian NSE 500 and Futures stocks ?
Hi,
Yes, the Ichimoku dash works on whichever charts your MT4 broker supports.
It will load values for “Shift” bar. Which you can specify in Properties.
For my other scanners like MA Confluence ProfitPercent with MaxPastBars…
just make sure that the stock which you are using has at least those number of history bars downloaded.
Or else dash might not function properly 🙂
You can see in this image that AMAZON has 2048 bars downloaded. So only use less than 2048 Past Bars in dash:
i need this but for mt5
Hi there,
I don’t have a version for MT5 yet.
Sorry about that.
Hi Abir, I’ve been reading all the comments about the Ichimoku scanner for mt4 and I’m just about to purchase it but I was wondering if you have a timeline for a MT5 version. You mention in the comment above I don’t have a version for MT5 “yet”. Many thanks – it looks a fantastic product.
Hi Steve,
I don’t have a timeline for MT5 version.
I’m hoping someday, but I doubt anytime soon.
I don’t really have any plans for it. Because I’m not very experienced with MT5 coding.
I hope you like the MT4 version 🙂
Hi Abir
Thanks for the reply. Yes I absolutely love your dashboard and the way it works but I wonder if you have some recommendations on the distance parameters. I’m only using M30,H1,H4 and D1. Trying to get quicker signals without sacrificing accuracy. Overall, I have had 16 from 18 winning trades using Ichimoku and your dashboard but I do notice that the entries are quite a way after the crosses. I notice your YT video uses much smaller parameters – 10.20.30.40. Any input would be useful – only been using it for 3 days!
No issue about the mT5
Hi,
Yes, the 10,20,30,40 are just example params I used. Real params would probably be a bit higher depending on your strategy.
Like for M30,H1,H4,D1 TK Min Distance could be: 50,90,120,200 or something.
Try the Crosshair tool to see which distance suits you for each timeframe.
The default strategy is:
Price>Kumo
Tenkan>Kijun
Chikou away from price and away from cloud
This is a safe strategy, but will give alerts a bit late.
If you need quicker signals, you could try removing Chikou. But be careful. Because Chikou provides a lot of safety 🙂
Other Strategies to try (Only Trade in direction of higher trend alignment):
– Only Kumo Breakout (trade pairs with a very good volatility based on best timings).
– TK Cross after Tenkan and Kijun separate enough. And Price is above Tenkan.
Use NRTR for StopLoss.
– If you are just scalping, then use Tenkan-Price retracements:
When a good trend is going but you are not sure if it will continue.
E.g For BUY: When price is trending up.. Wait for Price to touch Tenkan go under, and within 2-3 bars go back up. Place Buy. And wait for price to touch tenkan again and close the trade.
This way you can scalp a trend several times. Place tight stops. Maybe near Kijun.
Here’s an article explaining some strategies:
https://tradingstrategyguides.com/best-ichimoku-strategy/
Brilliant, thanks for the reply. One final question if I may?? When the scan runs, some of the buttons have a number in brackets but I’ll struggling to find out what the number refers to exactly. For example, B-Zone tick Arrorw (7) . Most of the icons are obvious but I notice that the bracketed numbers only appear on the highest timeframe with a signal. is there significance in the actual number shown??
This is a brilliant tool by the way!!
Many thanks
Steve
Hi Steve,
The numbers in the bracket show how many bars back the Price-Kumo breakout occurred.
So user can know about how long since the trend originally started.
And you can set parameter: “Show Kumo Breakout Past Bars (x)” to scan ‘x’ number of past bars.
Because based on your strategy parameters, the Buy/Sell Signal can happen multiple times during an Up/Down Trend.
Example, if TK Cross is true and Tenkan-Kijun cross might happen several times.
Or if stochastic is true, it might go OB/OS and back several times.
So, if Kumo Breakout has happened recently, it means trend is new and might continue.
But if it had happened a long time back, then to be careful, as trend might be ending soon.
Hi Abir
Thanks for great coding and amazing indicators!
I would like to purchase Ichimoku Scanner but MQL5 don’t use Paypal. Is there another way I can get the Ichimoku Scanner?
Hi,
Yes there have been problems for a lot of people when mql5 site removed Paypal.
I’ll slowly add all my products to my website and provide Paypal.
I have added Ichimoku scanner here:
https://abiroid.com/product/ichimoku-scanner-dashboard
Best Ever 😍😍
Thanks 🙂
i like your new page
Thank you 🙂
Hello Abiroid…is there a way to modify the settings so I can get the scanner to do Kijusen Cross scans???? Thank you if not, its not the end of the world this is an amazing systemmmm
Hi,
Yes sure. You can keep all checks off and just use the 2 Kijunsen filters.
Did you want a cross for Kijun and Price or Cross check for Kijun and cloud?
Check out these settings screenshots. And set accordingly.