Abiroid Sway COG

45 $
Reversal based Swing Indicator
  • Price crosses lower COG Band.
  • Faster EMA Crosses Slower EMA Upwards (and below inner COG band)
  • Higher Timeframe Trend Alignment
  • NRTR Support/Resistance Check
  • Higher Period MA Trend Direction Check

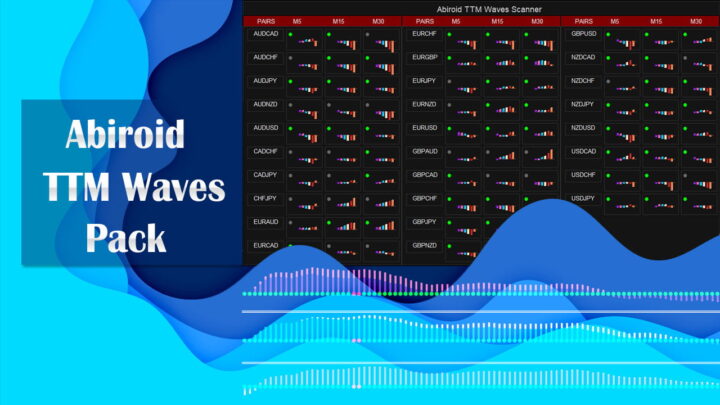
TTM Waves ABC with BB Squeeze

30 $
Download Pack contains 2 types of TTM Wave Indicators and a Scanner:
  • 2 waves (and BB Squeeze)
  • 3 waves (and BB Squeeze)
  • Scanner Dashboard for multiple waves
Use these indicators to validate your existing TTM Waves strategy. 

Abiroid MA Stack

30 $
Download PackFree:
  • Single Currency & Single Timeframe MA Stack
Paid:
  • Single Currency & Multi-Timeframe Scanner
  • Multi-Currency & Multi-Timeframe Full Scanner Dashboard

Abiroid Customizer Arrows and Scanner

60 $
  • Specify your own Custom Indicator
  • Specify Buffer values and create Variables
  • Use those Variables to create your own Buy/Sell Conditions
  • Get Arrows Up/Down Signals
  • See Arrows Signals in Scanners and how many bars back Signal occurred
  • Get Alerts on New Signals (Popup, Push, File or Email)

Abiroid Donchian Scanner and Arrows

60 $
  • Donchain Channel Break
    • Min Channel Jump Points
    • Max Tight Ranging Bars Before Jump
  • Check High Volume
  • MA Filter (Buy: Price > MA OR Sell: Price < MA)
  • ADX > 25
  • HTF Align SMA

Abiroid Support Resistance Scanner

32 $
  • Scan Support/Resistance zones
  • Show alert when price is inside these zones and highlight
  • Show or hide SR zones prices
  • Show or hide current price distance in points from SR zones

Abiroid Supertrend Scanner

32 $
Simplistic Supertrend scanner dashboard
  • Select: xSupertrend or Supertrend_CCI
  • Or select your own Custom Supertrend indicator
  • Supertrend Trend Direction Change Scan
  • Supertrend HTF Align

Abiroid Halftrend Scanner

32 $
  • Scan Max Past Bars for Halftrend arrows
  • Scan HTF for Halftrend Trend Direction
  • 3LZZ Semafor before HT Arrow
  • Price Cross Check and Price distance to Halftrend Line

Abiroid EMA Scalper

50 $
  • 1: MA Crossover Up/Down Arrow (Mandatory Check)
  • 2: If NRTR Check On (Optional):
    • If NRTR Shadow Distance On (Optional)
  • 3: If High Volume bar On
  • 4: If HTF Trend MA Align On (Optional)
  • 5: If TMA Slope On (Optional)
  • 6: MA Check (Optional)

GMMA Trend Scanner

32 $
  1. Current TF GMMA Cross and Trend (Mandatory Check.. G-Up/G-Down)
  2. HTF GMMA Trend Check (Optional.. slanting arrow)
  3. TDI or NRTR Trend Check (Optional.. diamond)

TDI Scanner Dashboard

65 $
  • SharkFin Pattern
  • Check Strong/Weak Up or Down Trend and Strong/Medium/Weak BUY or SELL Signal
  • Check if not Overbought/Oversold or Consolidation and Volatility
  • Check if away from SR (if SR set to true)
  • Check higher TF trend align (if set to true)
  • Daily High/Low Detection

ProfitPercent Arrows MA Confluence

65 $
  • Main Signal Indicators (Any One): MA Cross (In-built) or Hull, OBV Cross, Heiken Ashi Cross
  • Validation Indicators (Preferably less than 3): OBV (with Min Distance), Heiken Ashi, ADX, SuperTrend, PSAR, Higher TimeFrame EMA Alignment
  • If MA Cross and OBV Cross both are false, only then Heiken Cross will be taken as Main Signal.