


Abiroid BB Slope (Bollinger Bands)
0 $
Get from MQL5- Bollinger Bands Slope
- Histogram for Center Line slope
- Threshold values to set Histogram colors: Red, green
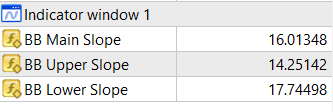
- Buffer values for all 3 lines: top, middle and bottom slopes
All products are non-refundable. Since these are digital products. No source code available, only executables. Please read product description carefully before buying.
This is a slope indicator for Bollinger Bands indicator. It provides slopes for BB top band, center band (main) and Lower Band.
You can also set a threshold value for Center line to control Red/Green slope histogram lines.
Here’s what the indicator look like:
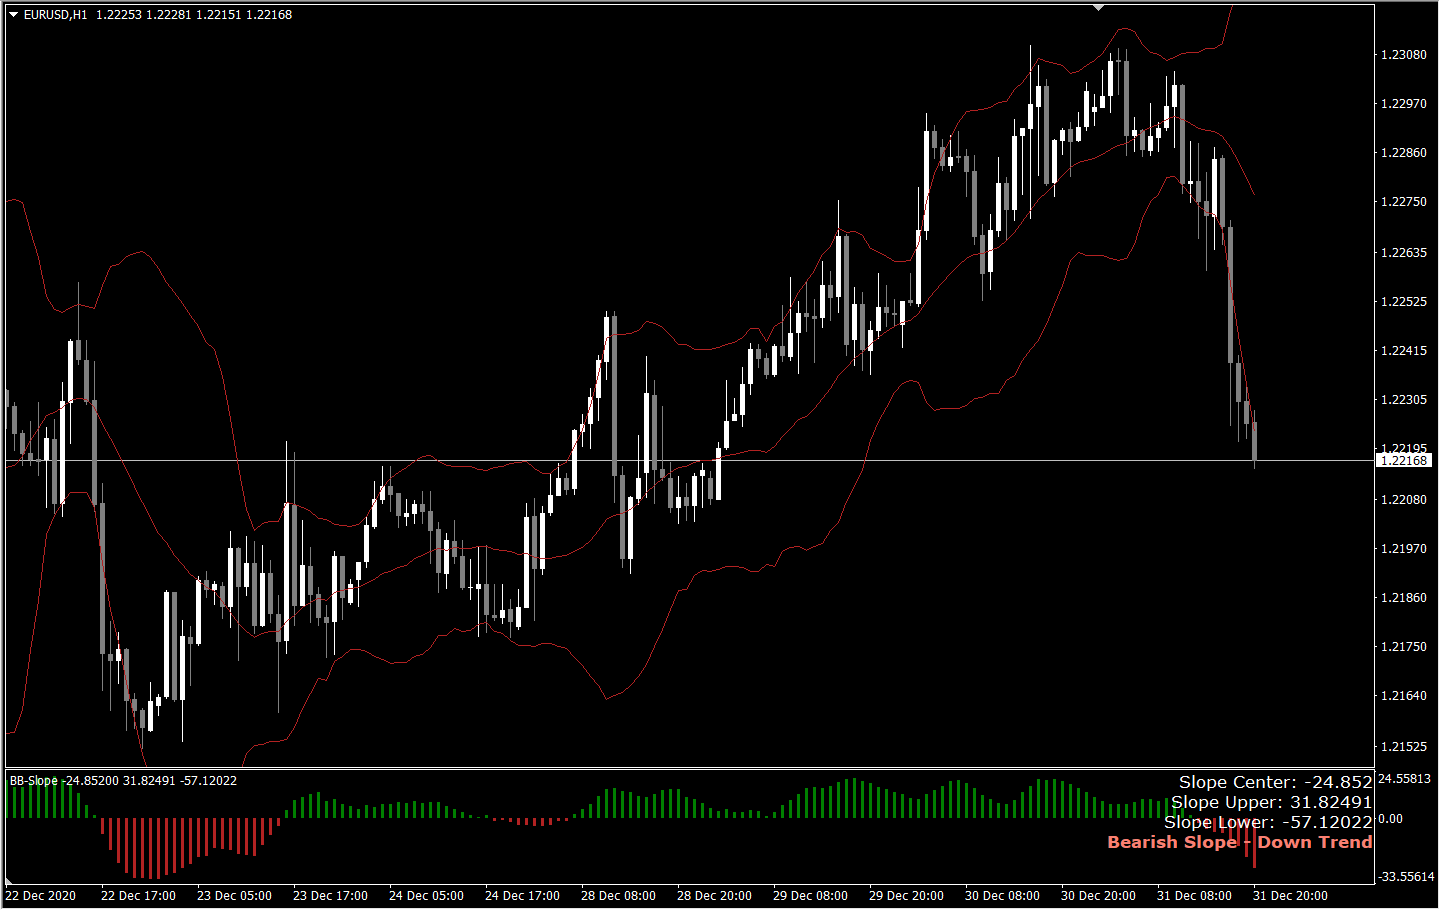
Slope Threshold: for indicating crossed levels. In the above Image the Threshold is set to 0, because of that all Bullish slope is Green and Bearish is Red.
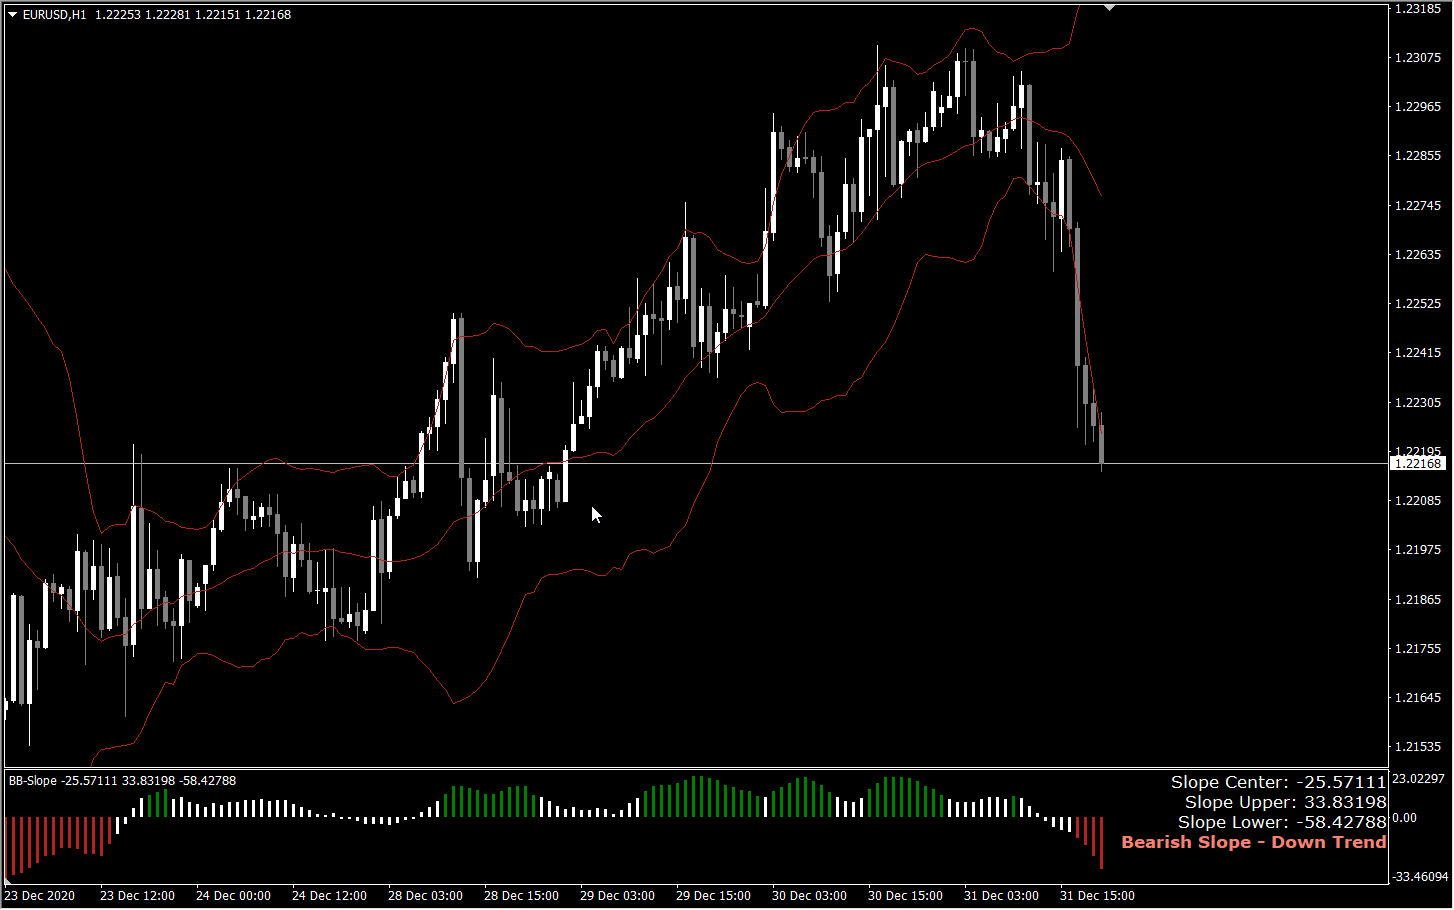
Suppose we set Threshold to -10 and 10, then this is what we get:
Buffers: values for specified bars back.
Buffer 6: BB Center Slope
Buffer 7: BB Upper Slope
Buffer 8: BB Lower Slope
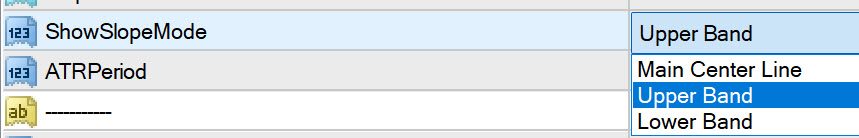
You can choose which line you need the slope and Threshold Alerts for in Drop down.
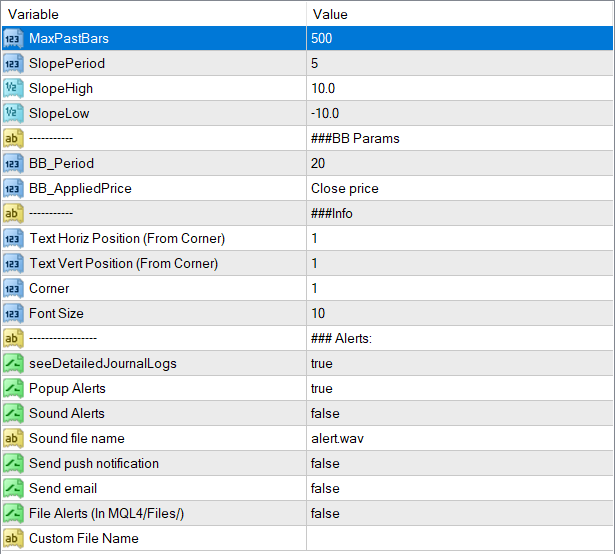
Alerts: when slope changes. They only happen when Threshold is crossed. e.g.: If Threshold is 10, -10 and if slope goes from say 9… to above 10.
And can be Popups, Push Notifications, Email or in a File.
Slope Period: Default is 5, which means it will measure the line values for past 5 bars and find the Slope based on time for past 5 bars.
What slope means:
Center Slope:
This slope indicates whether price is trending up or down
Upper/Lower Slopes:
These can be used to calculate volatility. Whether bands are closing or opening up.
In Bollinger bands, if bands are opening up, means trend is picking up and volatility is increasing. So it’s good to trade.
Bands coming together, meaning upper band going down or lower band coming up, then consolidation period. So wait and don’t trade yet.
Best Use:
Use this slope indicator to supplement your existing Bollinger Bands strategy.
Or use the buffer values with an EA to figure out the ongoing trends and consolidations.
Related products


Darvas Box Strategy Arrows and Scanner
- Check Darvas Box Breakout
- Check Price Above/Below MA or Darvas Box has crossed MA
- NRTR Trend Check
- Heiken Trend Check
- MA Slope Check
- Higher Timeframes Price and MA check
- Fixed Stop Loss and Take Profit Option
- Variable Stop Loss at Darvas Box or Darvas Pivots or selected MA
- Calculation of Profit Loss Points and Win/Loss Count and Profit Percentage


Abiroid Auto Fibo Indicator
- Blue Diamond if price Price crosses towards Trend
- Orange Diamond if price reverses towards retracement


