
Abiroid Reversal Channels and Scanner
Original price was: 55 $.40 $Current price is: 40 $.
- Top/Bottom Reversal Strong and Weak Signals
- Upper/Lower Channels and Mid line with HullMA
- Scanner and Alerts for Signals
- MACD Divergence Filter
All products are non-refundable. Since these are digital products. No source code available, only executables. Please read product description carefully before buying.
Top G Reversal Channels and Scanner for Metatrader 4 (MT4):
Based on the idea and script sent to me by Omniman:
https://abiroid.com/ideas/mt4-indicators/make-a-screener-for-this-reversal-channel-from-tradingview/
Features:
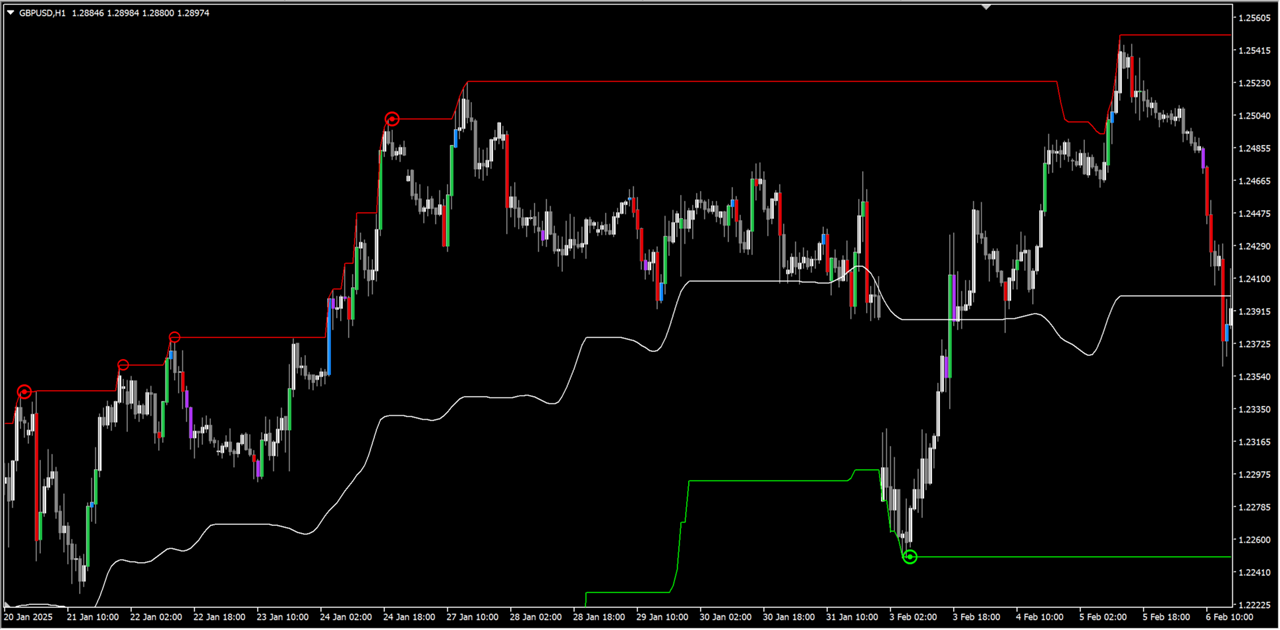
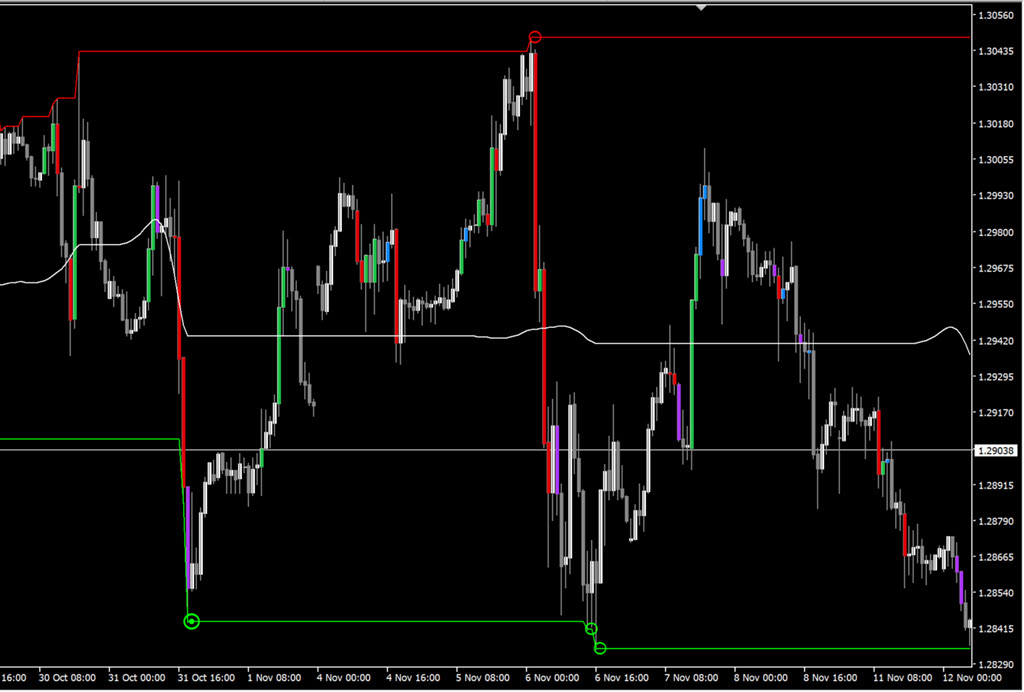
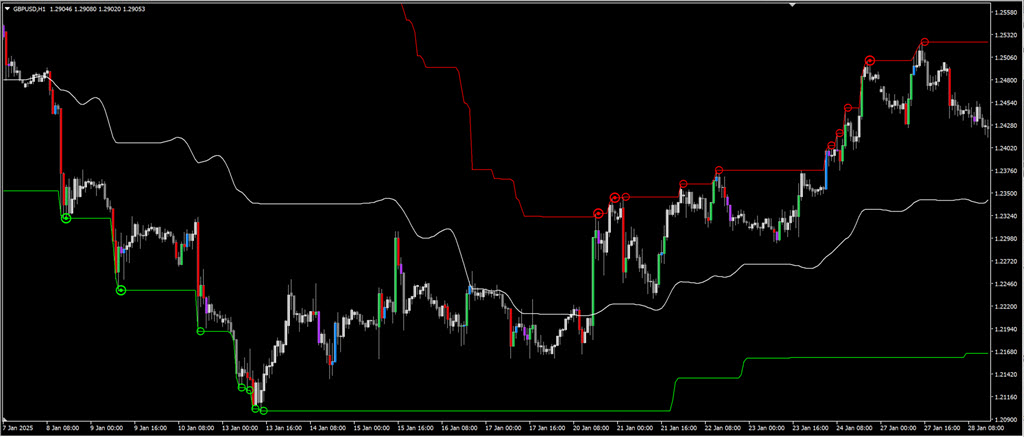
- Creates Top and Bottom Channels to show Ranges
- High probability Reversal areas (filled circle) and Weak reversal areas (empty circles)
- A mid line to show overall trend using HMA
- Alerts when reversal points happen
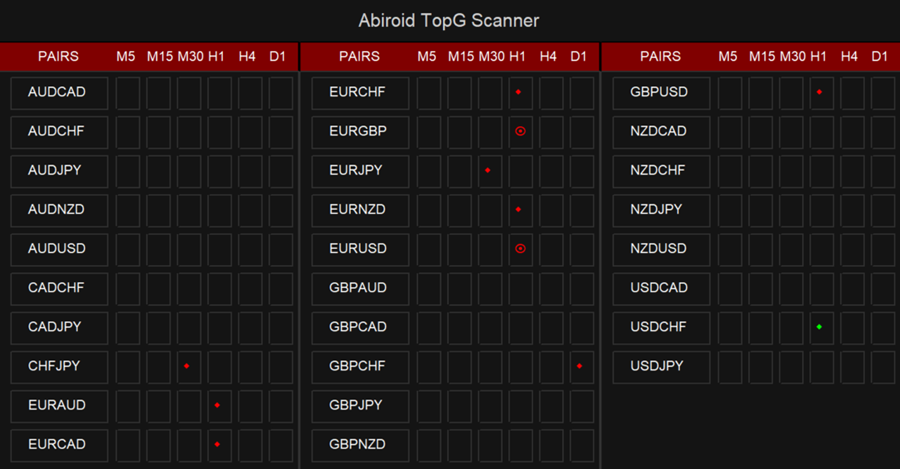
- A scanner to show current bar signals
- MACD Divergence Filter
You can change the signal arrow codes.
Scanner will only show signals for ‘Shift’ bar. Default shift is 1:
Free Downloads:
Demo: Works on 3 pairs EURUSD or USDJPY or AUDUSD
Volume:
After a signal, if price still looks low volatility and like it’s ranging, wait for a high volume candle in direction of the reversal.
Quarters:
Areas near strong SR lines like: Quarter points, pivots, Supply/Demand areas or Fibo etc, have an even higher reversal chance.
So use validating indicators to check signals.
How to Use?
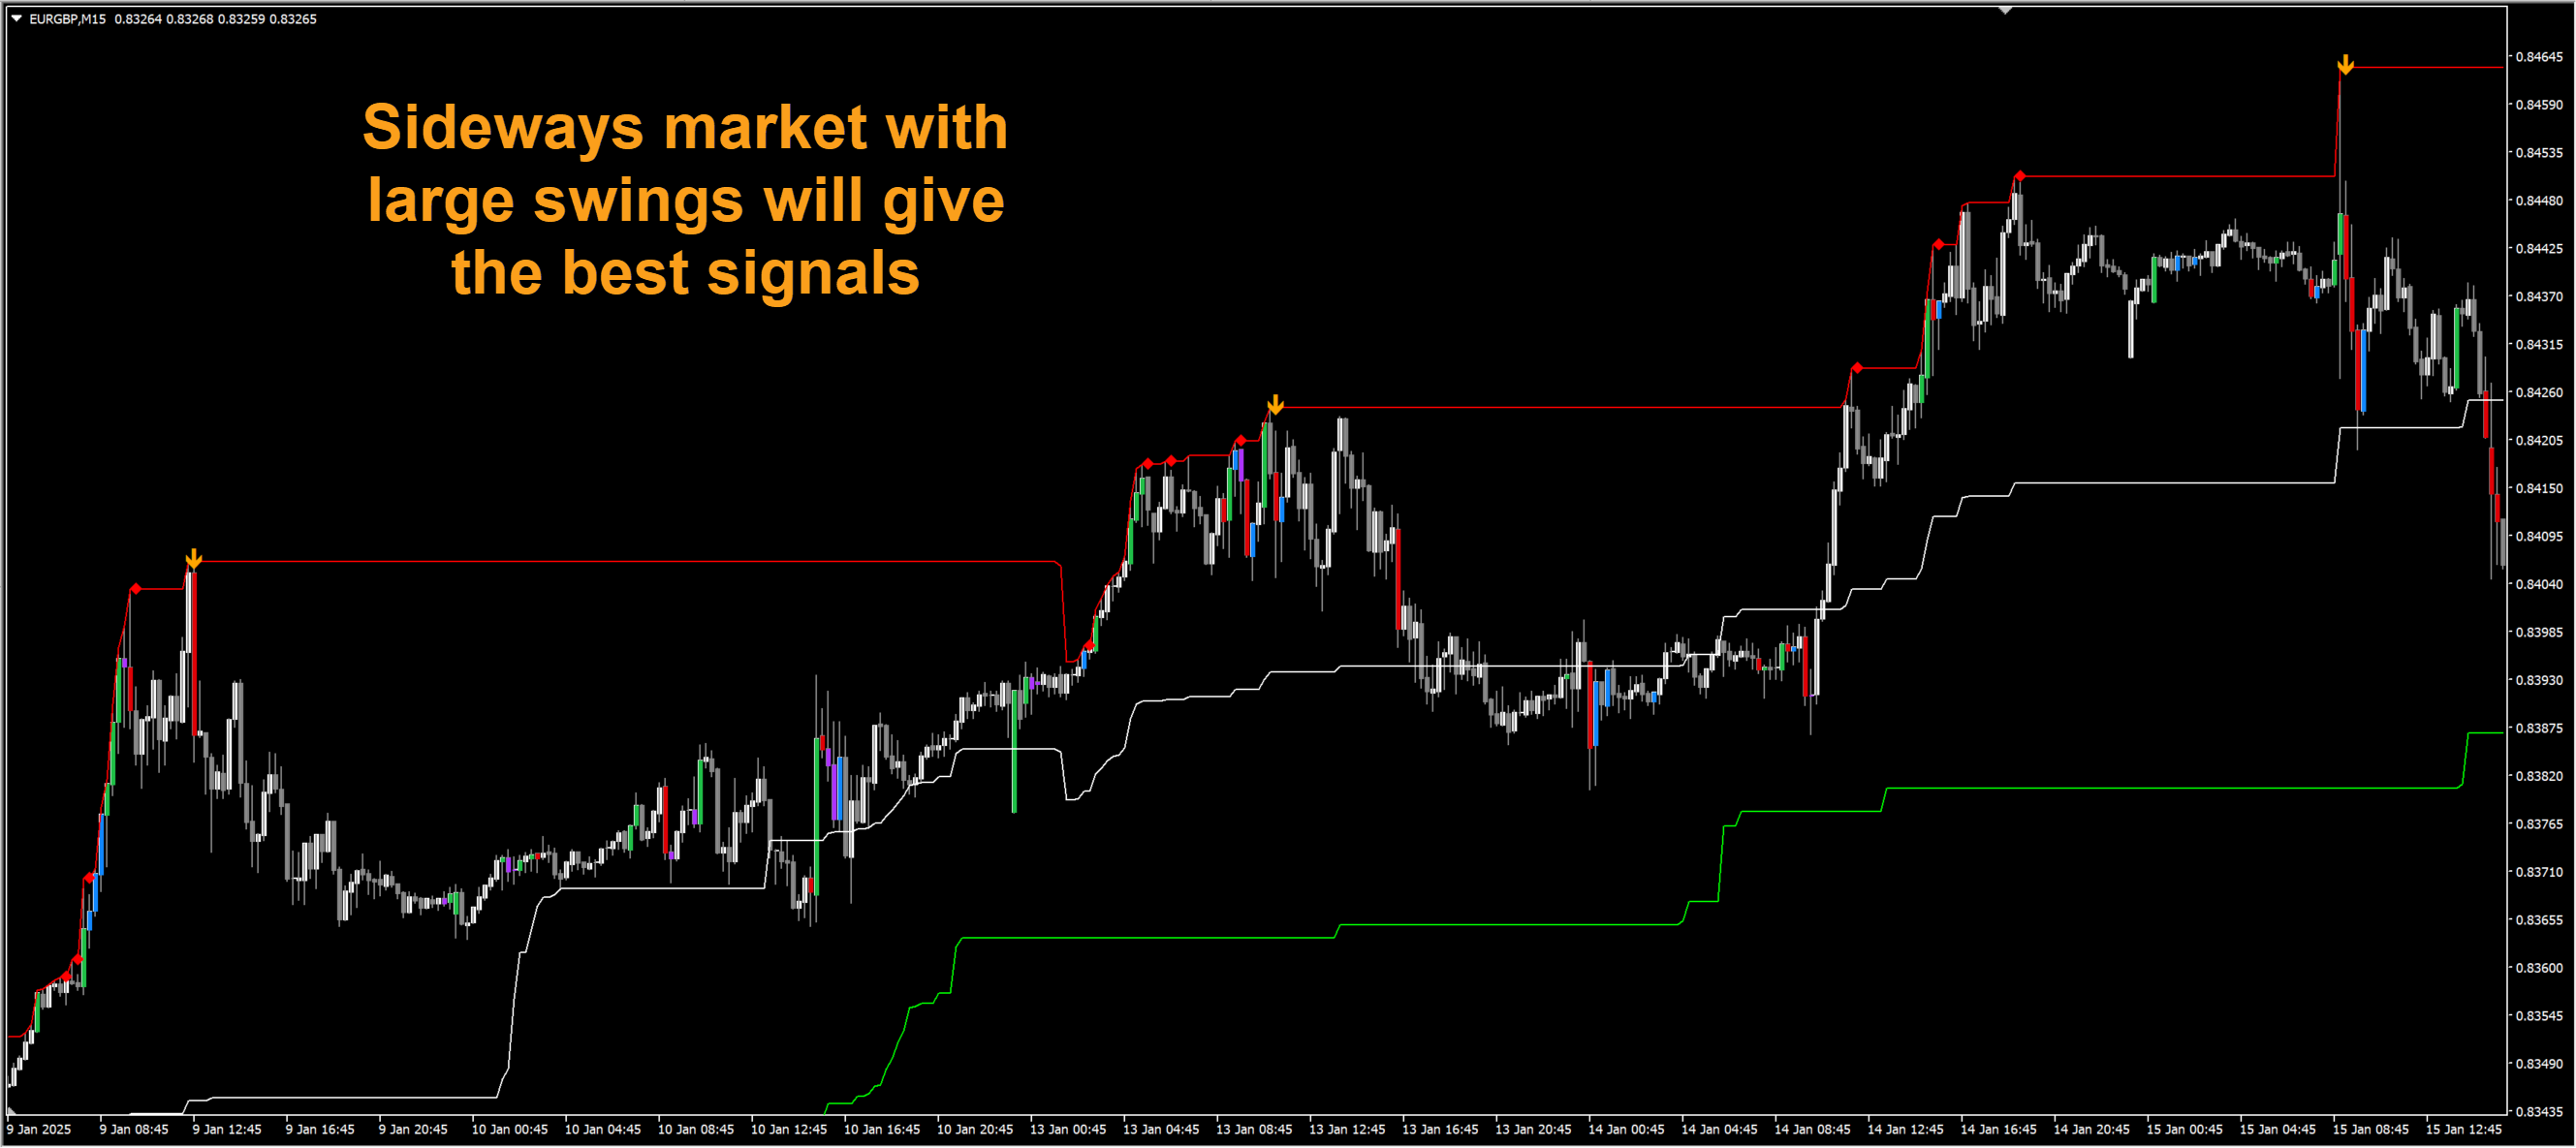
This is a reversal indicator, so best signals are when price is in a good volatility period making large swings in a sideways market.
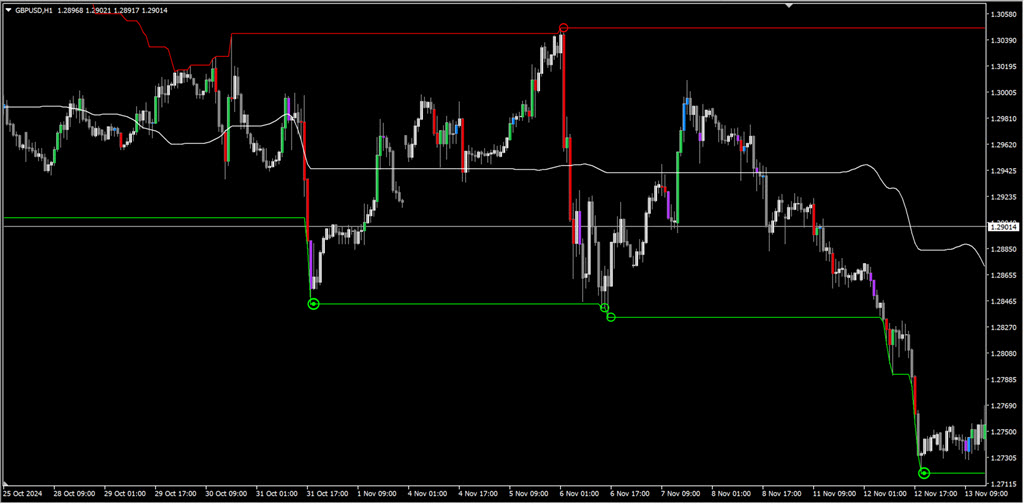
Trade:
Guide screenshots:
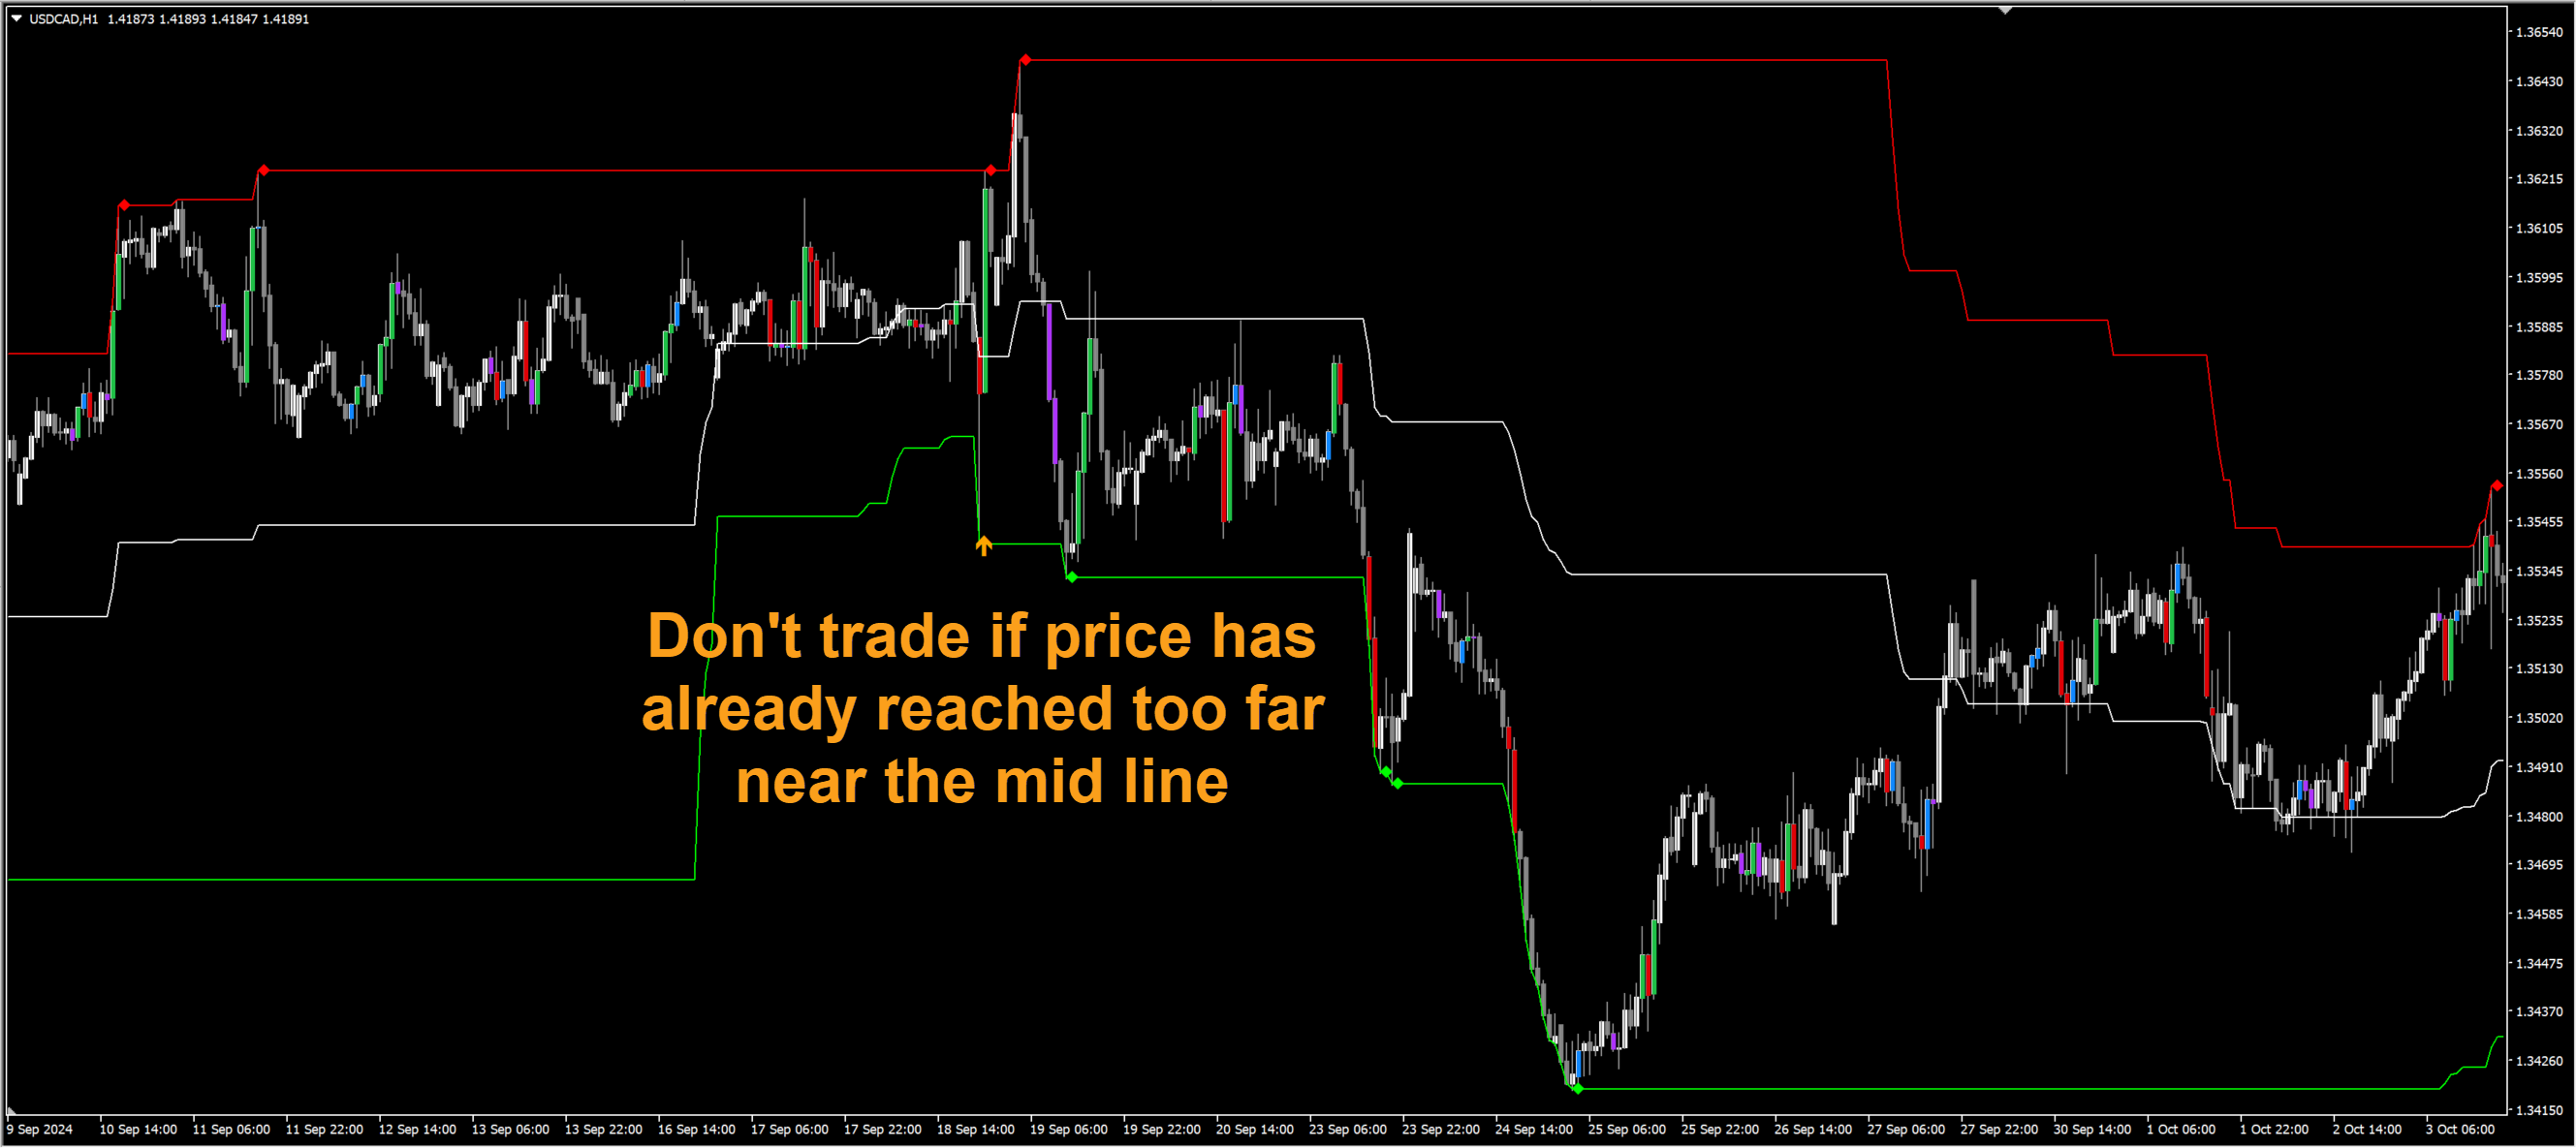
After a signal from scanner, make sure to study chart first before making a trade. Mainly, the mid line HMA will tell you if price is going sideways, or in a ongoing up/down trend.
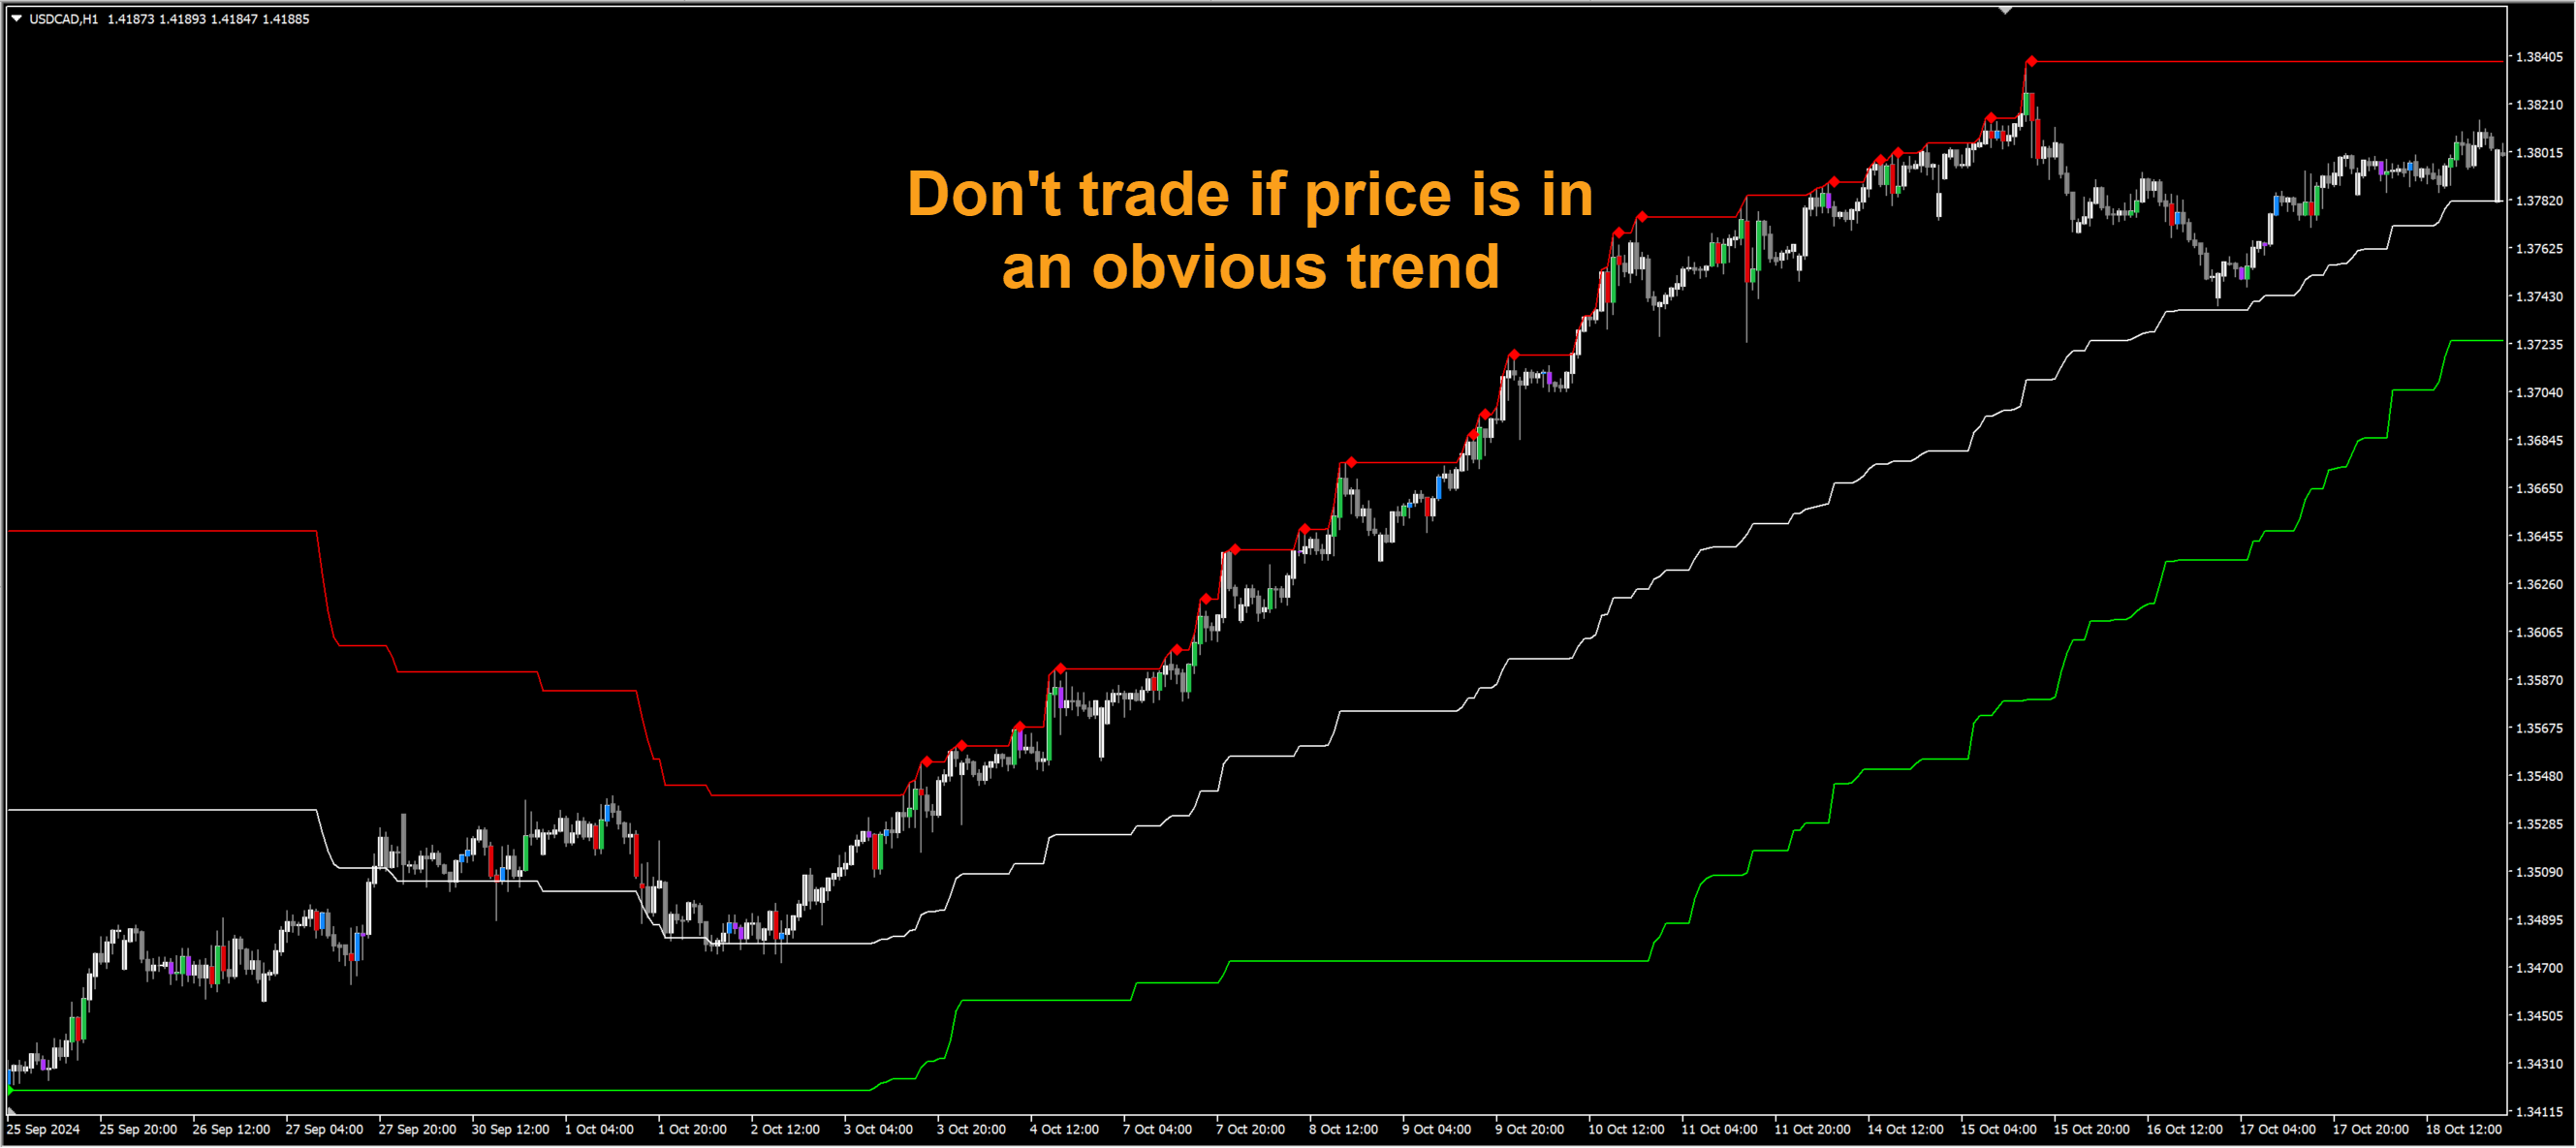
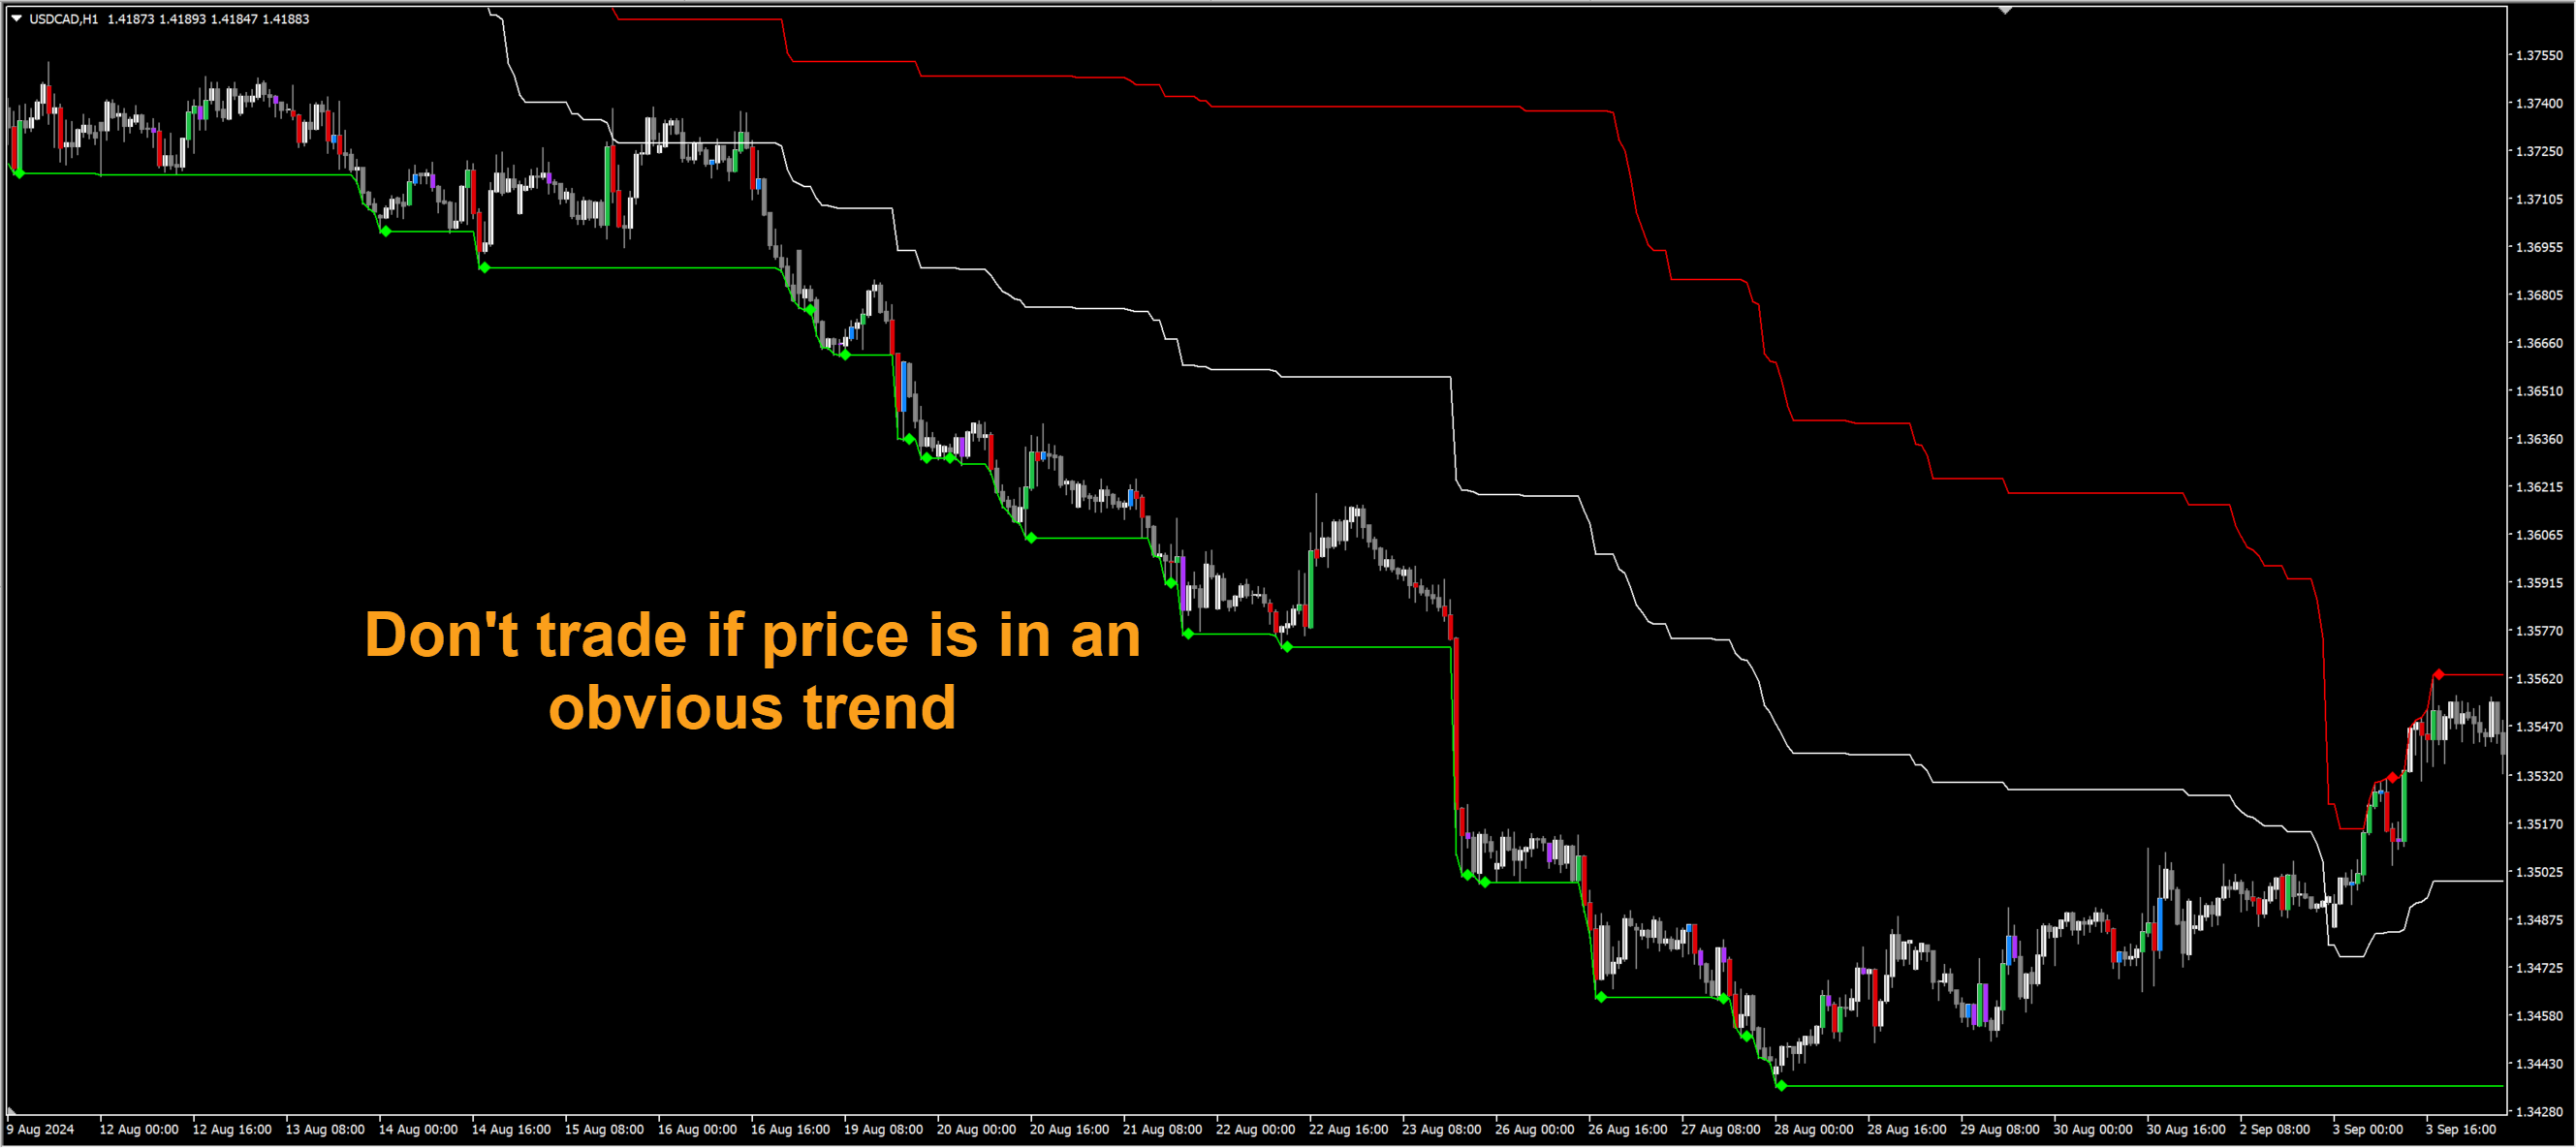
Also look at the next higher timeframe to make sure that price isn’t in a strong trend.
Be careful with signals when HMA (mid line) is going upwards or downwards.
Signals like these:
Even though price does reverse, but the reversals don’t go too far. Never reach the mid line, because price is in a clear Up Trend.
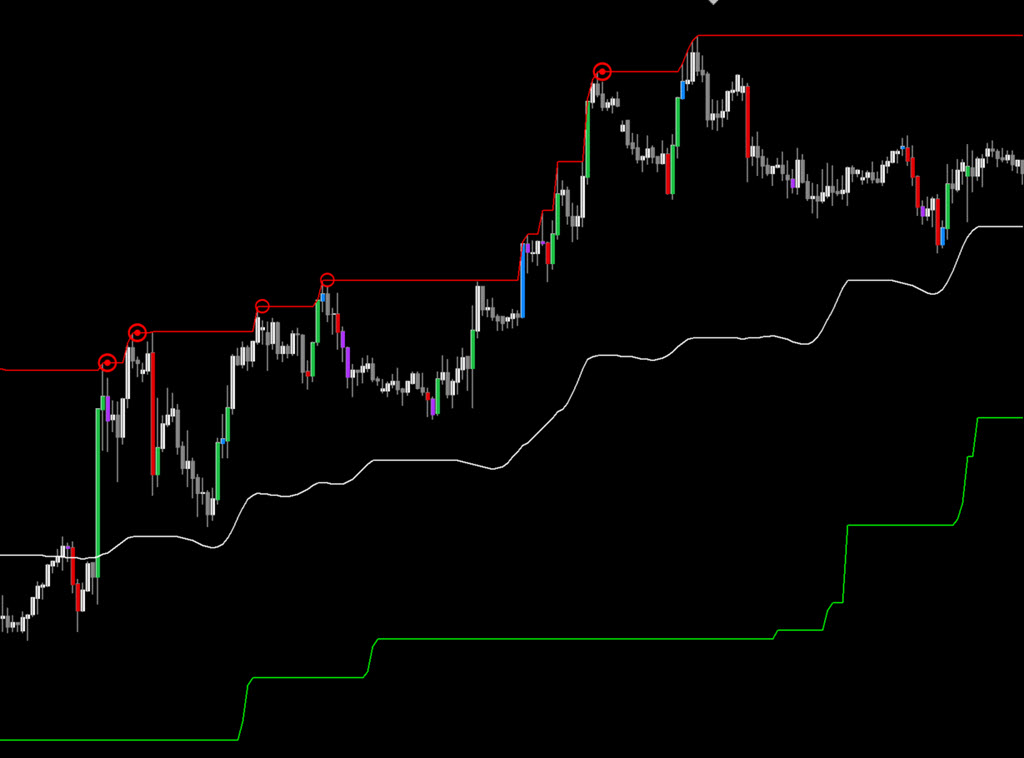
Best signals are when mid line keeps moving sideways a lot more:
Mid Line:
For Mid Line you can turn HMA On/Off. When off, it will calculate the midline using average of the upper and lower channels.
HMA On will use the Hull Moving Average to calculate the mid line.
MACD Filter:
When price is trending, it will keep making higher highs or lower lows, and it might keep finding new top/bottom signals like these:
MACD Filter will look for divergences. Where macd is showing weakness but price is still in a trend on chart. This MACD Divergence will indicate a stronger reversal chance.
And rest of the signals will be ignored. This is the same chart with MACD on for weak signals:
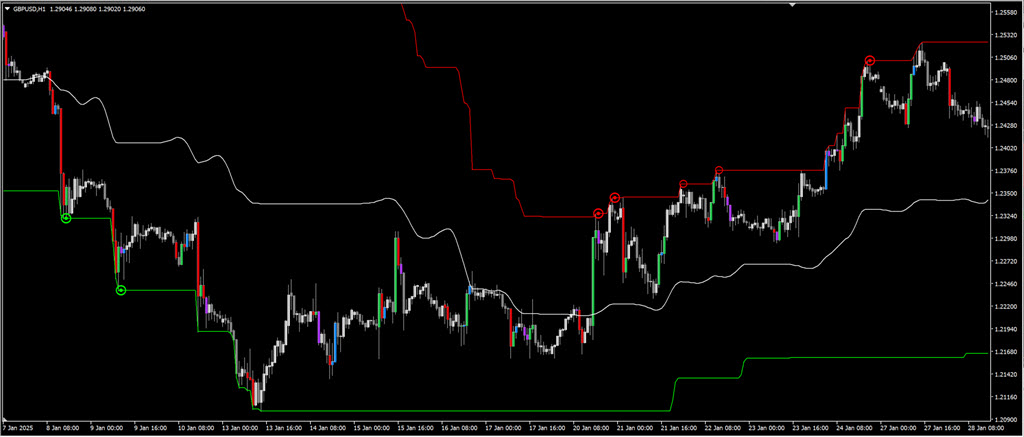
Keeping MACD on for Strong signals also, will make you lose a lot of signals:
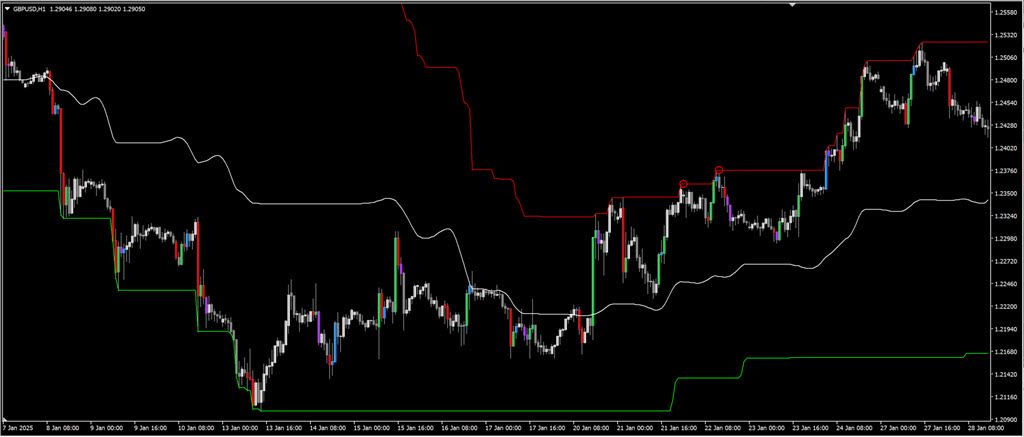
So for strong signals just visually check the chart and make sure not to trade against the trend. And keep MACD off.
Stops:
If scalping, then keep very tight stop loss.
And if you are not scalping, then keep stop loss a bit more above/below the signal. Near a possible SR area (if you are using pivots etc)
Just make sure to have a good SL:TP Ratio. Maybe 1:2 or even 1:3. Depending on the type of ongoing market and swings.
So even if you lose a few trades, your loss will be smaller. And overall profits will be a lot more.
So to recap…
During sideways range: Trade both direction signals
Trends: Trade only signals in direction of overall trend. If trading reverse direction signals, be careful.
Low Volatility very tight range markets: Don’t trade
Scanner:
The dashboard will only show signal for a bar you define. Default shift 1. And give alerts. The set files between scanner and arrows are interchangeable.
So when trying out different settings, try using arrows on an individual chart. When satisfied, just save set file. And use it in scanner.
Note that scanner when used for 6-7 timeframes for all 28 pairs can get a bit heavy, and will take about 8-10 seconds to load.
Settings:
Arrows:
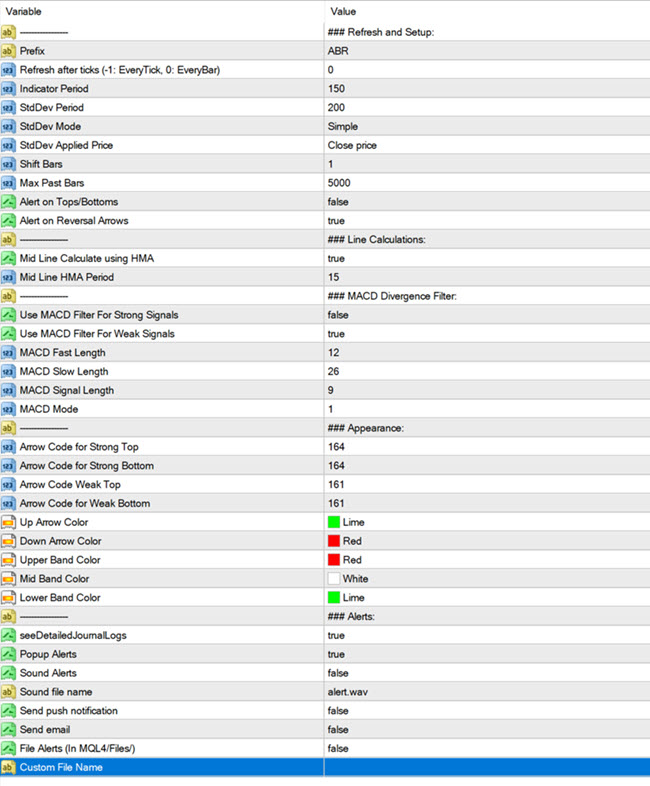
Indicator Period will calculate the Rate of Change. To find Tops/Bottoms. And Standard deviation period is then applied to it to refine signals.
Keeping a higher indicator period will give you more distant bands finding longer ranges. Keeping it lower will give you tighter bands finding smaller ranges.
So, if scalping, you can keep tighter channels, and hide the weak signals.
Scanner:
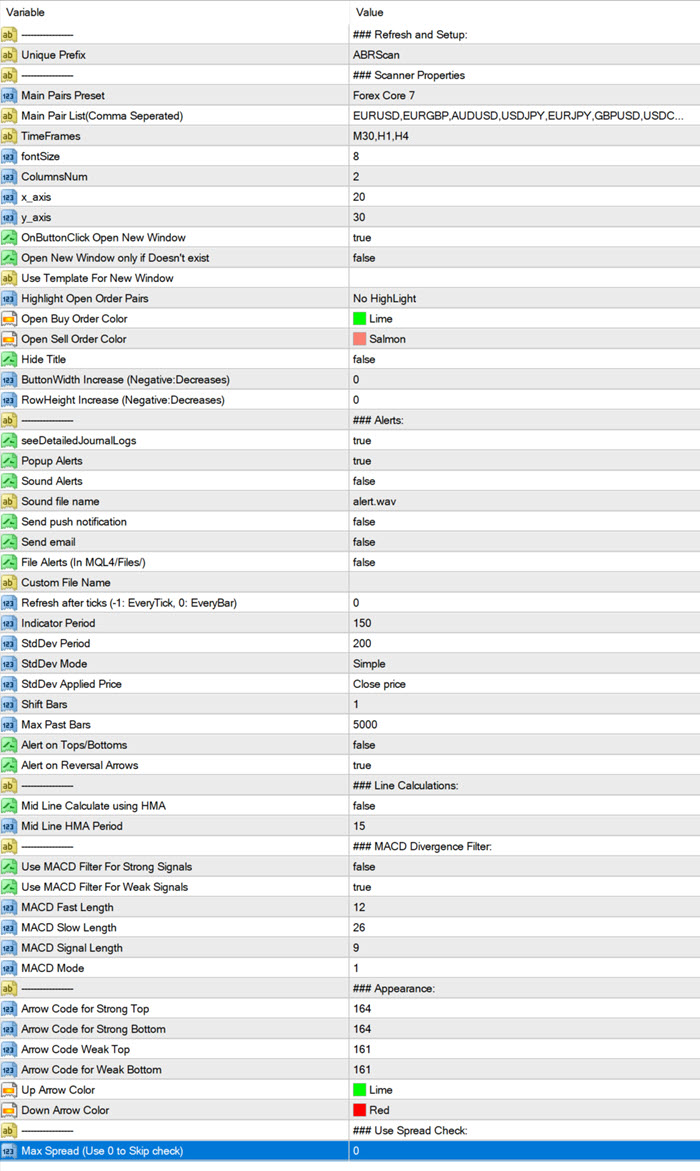
Common Scanner Settings:
https://abiroid.com/abiroid-scanner-dashboard-common-settings/
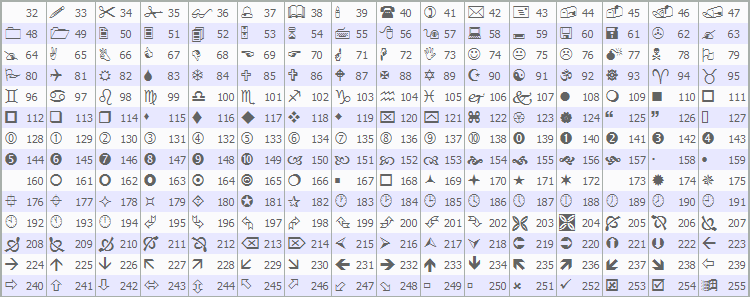
Change arrow code using Wingdings codes:
Changelog:
v1.0 Base version
v1.1 Refined signals more
v1.2 Fixed Hull MA, and option to hide weak signals
v1.3 Added MACD Filter
Related products


Abiroid Auto Fibo Indicator
- Blue Diamond if price Price crosses towards Trend
- Orange Diamond if price reverses towards retracement


