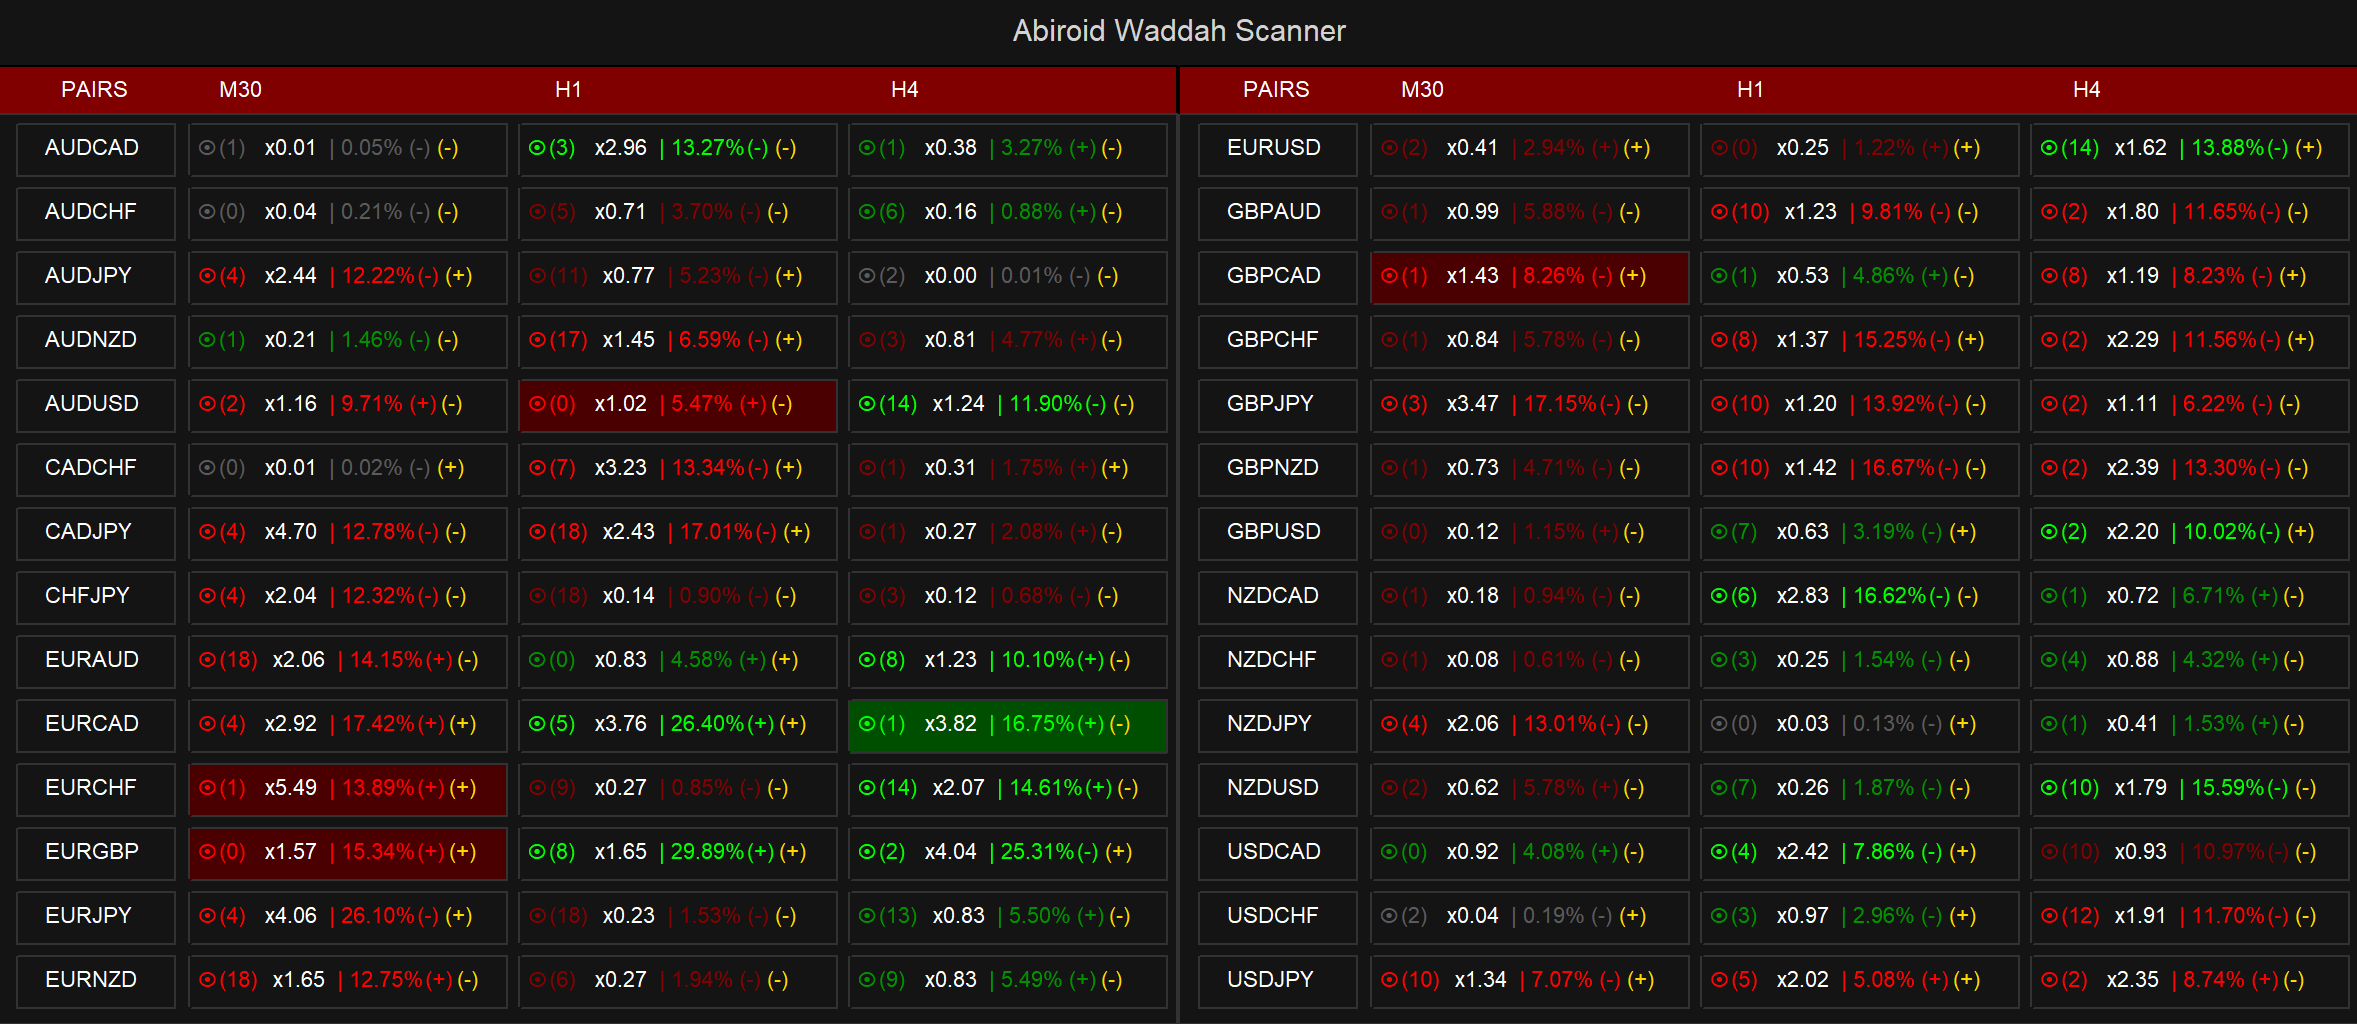
Abiroid Waddah Scanner
45 $
Buy from MQL5- Waddah Trend, Explosion Increase/Decrease
- Trend Percentage with Threshold
- DeadZone
- Trend Direction Aligned Checks
- Highlight and Alerts
- Multi-Timeframe & Multi-Currency
All products are non-refundable. Since these are digital products. No source code available, only executables. Please read product description carefully before buying.
Waddah Explosion Scanner Features:
- Waddah Trend, Explosion Increase/Decrease
- Trend Percentage with Threshold
- DeadZone
- Trend Direction Aligned Checks
- Highlight and Alerts
- Multi-Timeframe & Multi-Currency
Customizable Threshold:
With customizable threshold, you can identify best trading opportunities in volume-based trading.
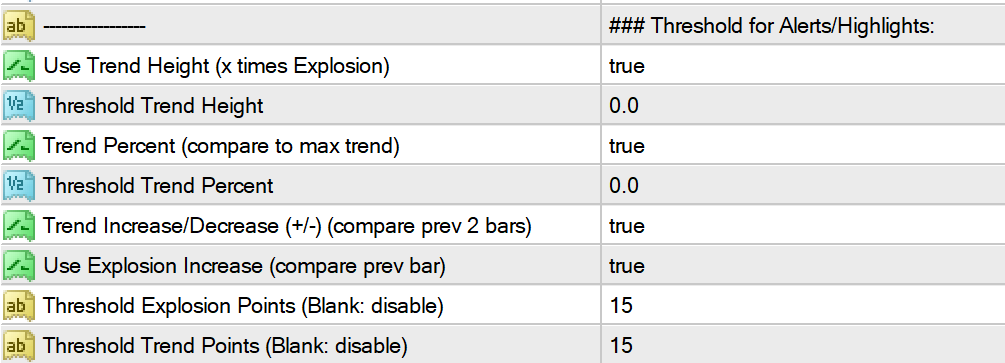
- Use Trend Height (x times Explosion): Trend height in relation to the explosion signal (customizable threshold).
- Trend Percent: Compares the trend height to the maximum trend and applies a threshold for trend percent.
- Trend Increase/Decrease: Trend increase or decrease compared to the previous bar.
- Explosion Increase/Decrease: Explosion increase or decrease compared to the previous bar.
- Trend or Explosion Threshold (Values in Points): Waddah value or explosion value needs to be above this threshold.
Alerts:
- Alerts based on trend height, trend percent, trend increase/decrease, and explosion increase/decrease.
- Debug messages on/off
Video Tutorial:
Free Demo:
Demo limited to any 3 pairs.
Free Simple Multi-meter:
Waddah Explained:
https://abiroid.com/waddah-attar-explosion-for-scalping/
Components:
Waddah Trend:
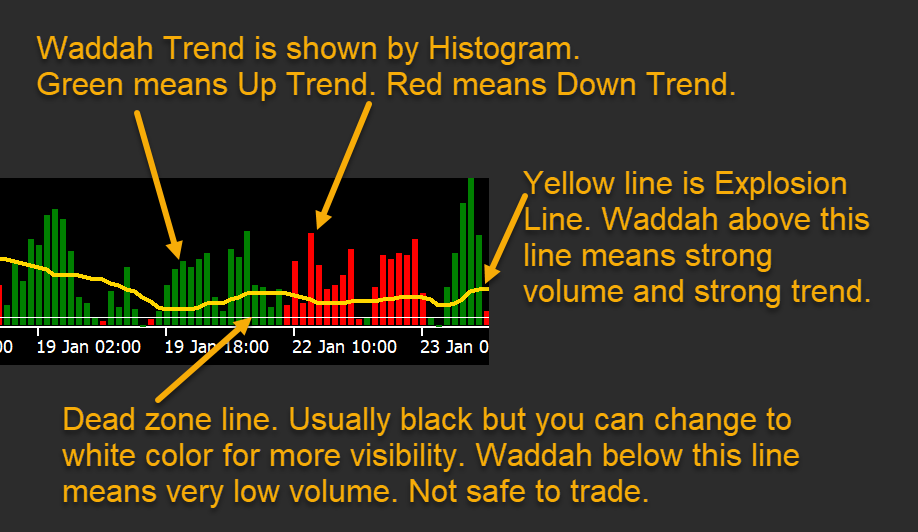
This is a histogram using red and green color lines. Red means Down trend and Green means Up trend.
Calculated using MACD trend difference between current and previous bar using “Waddah Sensitive” multiplier. It adjusts the sensitivity of the overall indicator. Generally speaking, the smaller the time frame and/or slower the market and conversely, the larger the timeframe and/or market volatility, the higher the number. The typically accepted range is 75-150. Default is 150.
Explosion:
Yellow line is calculated using Bollinger bands upper and lower difference. Which gives best way to know when market is in low volatility or high volatility mode.
Dead Zone:
The white line in image. We can define any point value here. Any waddah values below this line will be skipped. So good to find really high volume signals.
Scanner Symbols:
Alerts/Highlights:
Alignment:
The values will be comma separated corresponding to timeframes which are also comma separated.
Suppose M15,M30,H1 are timeframes, and “Trend Alignment Check (for Timeframes)” is “a,b,c” then a corresponds to M15; b corresponds to M30 and c corresponds to H1.
First timeframe value will be used to compare all other values. It will be the “Reference Timeframe”. Which is why it must be > 0. It cannot be 0 or negative.
Trend Direction Values:
It will consider 3 checks:
- Waddah Trend (Green: Up Trend and Red: Down Trend)
- Explosion: If Waddah is above Explosion line (Yellow line)
- Trend Bars: If Trend had started at least within “trend bar” number of past bars.
Use the following values in a comma separated list. In “Trend Alignment Check”.
Each value will correspond to it’s timeframe. Negative values mean opposite trend
No Check:
Waddah & No Explosion:
Waddah & Explosion:
Waddah & Trend Bar:
Waddah & Trend Bar & No Explosion:
Waddah & Trend Bar & Explosion:
Example:
Highlights:
- waddah is above the explosion line
- trend had started “TrendBars” back
- And all values are above thresholds
Same is true for individual timeframe alerts.
Thresholds:
Settings:
Scanner Settings:
shiftBars: Shift (Min 0) – Specifies the number of bars to shift on the chart. Minimum value is 0.MaxPastBars: Max Past Bars – Sets the maximum number of past bars to consider for analysis.RefreshAfterTicks: Refresh After Ticks (0: Disable) – Controls the refresh rate of the scanner based on the number of ticks. Set to 0 to disable.MaxSpread: Use Max Spread (0: Disable) – Enables the use of a maximum spread limit. Set to 0 to disable.
https://abiroid.com/abiroid-scanner-dashboard-common-settings/
Scanner Appearance:
InfoSameLine: All Info Same Line – Specifies whether to display all information on the same line.UpStrong_color: Strong Bullish Color – Sets the color for strong bullish signals (above the trigger line).DnStrong_color: Strong Bearish Color – Sets the color for strong bearish signals (above the trigger line).UpWeak_color: Weak Bullish Color – Sets the color for weak bullish signals (below the trigger line).DnWeak_color: Weak Bearish Color – Sets the color for weak bearish signals (below the trigger line).None_color: None Color – Sets the color for signals below the dead zone.ExtraInfoColor: Info Color – Sets the color for additional information or explosion line info.Bullish_BG: Bullish Background Color – Sets the background color for bullish signals.Bearish_BG: Bearish Background Color – Sets the background color for bearish signals.spacing: Spacing – Specifies the spacing between different elements.
Alerts On/Off:
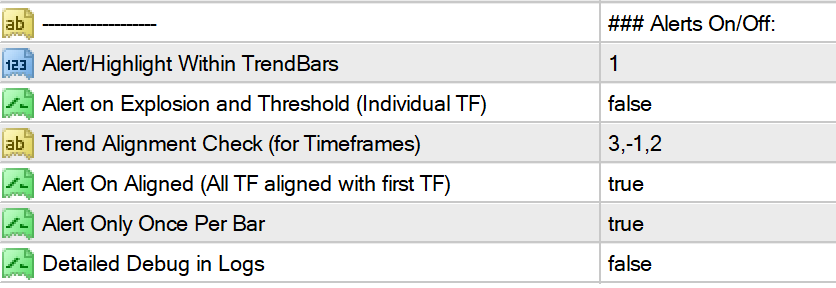
TrendBars: Alert/Highlight Within TrendBars – Sets the number of bars within which alerts/highlights should occur.AlertOnExplosion: Alert on Explosion and Threshold – Enables alerts on explosion and threshold values for individual timeframes.TrendAlignDirection_Str: Trend Alignment Check – Specifies the trend alignment direction for different timeframes.AlertOnlyAlign: Alert Only On Aligned – Controls whether to alert only when all timeframes are aligned with the first timeframe.AlertOnlyOnce: Alert Only Once Per Bar – Determines whether to trigger alerts only once per bar.DetailedDebug: Detailed Debug in Logs – Enables detailed debugging information in logs.
Keeping debug logs true will show you why an alert or highlight was ignored:
Changelog:
v1.0 Base version
v1.1 Added Thresholds
v1.2 Added Alignment Checks
v1.3 Added explosion on/off to alignment checks
| mql_site_link |
|---|


