


Range Breaker Scalper
60 $
Buy from MQL5- Range Breakout
- Breakout Bar: Min/Max Length
- Bull/Bear Power
- Tight Range before Breakout
- NRTR Trend and HTF NRTR Trend
- MA Stack Trend
- Zigzag High Low Trend checks
- Volume and Waddah Volatility Checks
All products are non-refundable. Since these are digital products. No source code available, only executables. Please read product description carefully before buying.
About:
Price ranges most of the time in forex… Like 70-80% of the time. And then it breaks out of the range to continue in a trend.
Even in a trend, price makes smaller ranges all the time.
Range Breaker Scalper is a tool to find the times when price breaks out of a range.
A sudden break means that price will continue on for next few bars towards the breakout.
So, these areas are best for scalping. Especially if breakout has happened towards the trend direction of higher timeframes.
Don’t trade all signals. Please use this with a validating strategy which will check ongoing trends.
And trade on at least M15+ and preferably H1.
This post describes some good strategies that work very well.
Features:
- Range Breakout
- Breakout Bar: Min/Max Length
- Bull/Bear Power
- Tight Range before Breakout
- NRTR Trend and HTF NRTR Trend
- MA Stack Trend
- Zigzag High Low Trend checks
- Volume and Waddah Volatility Checks
Video:
Free Demo:
Extras:
Scanner:
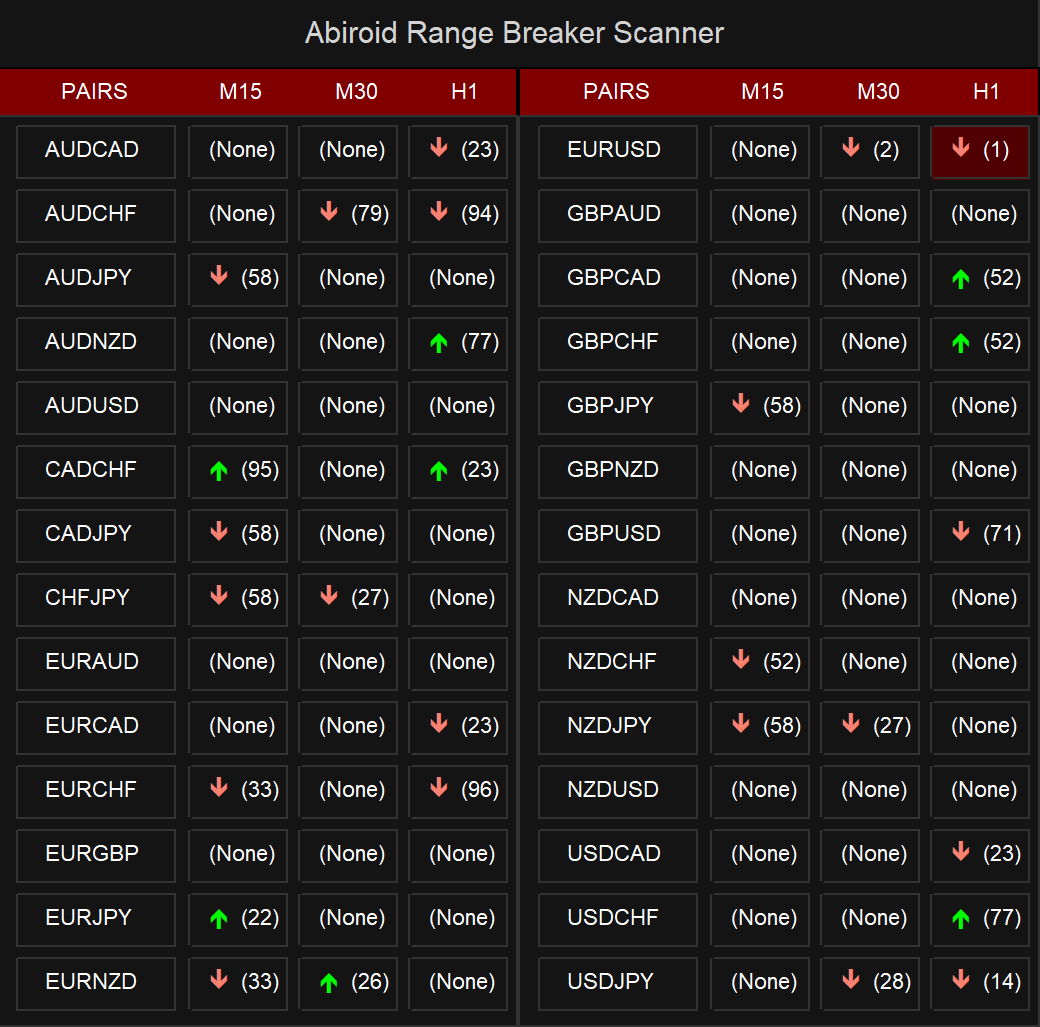
Abiroid Scanner Dashboard Common Settings
Settings:
Candle Settings:
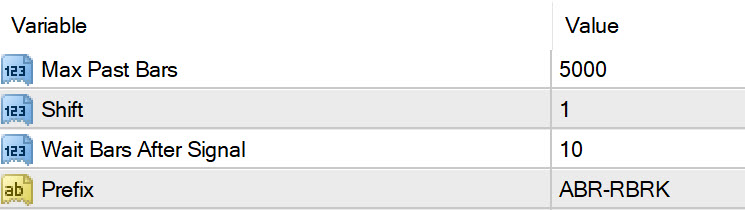
Max Past Bars: Total number of bars to scan
Shift: Starting at bar number
Wait Bars After Signal: After a signal, wait for at least these bars before searching for new signal
Prefix: It will use this prefix to draw all chart objects. And when indicator is unloaded, all the objects starting with this prefix are deleted. So make sure to have a unique prefix.
Breakout Settings:
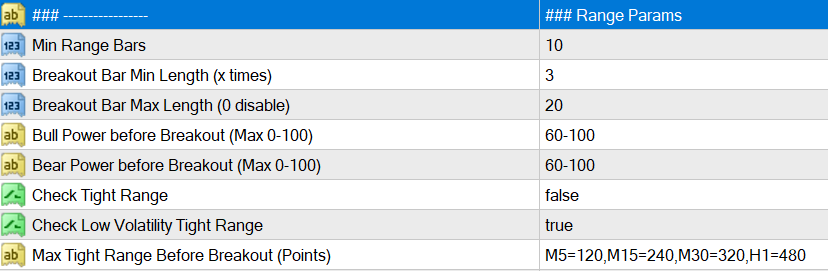
Min Range Bars: Minimum number of bars before breakout which make the range.
Breakout Bar Min Length (x times): Minimum Candle length for breakout bar.
Suppose if it’s 3, and Min Range Bars is 10:
then it will check if current bar candle is more than 3 times the average of past 10 bars.
Sometimes, if breakout bar has already reached too far, then it will retrace. So we should avoid those breakouts.
Breakout Bar Max Length (0 disable):
Use this to set a limit for breakout bar. Suppose it’s 20, then breakout bar should NOT be more than 20 times the average of past 10 bars.
Set this to 0, to disable this check.
Bull Power/Bear Power of Range (Before Breakout):
This is the percentage of Bullish or Bearish Average height of the past 10 bars (between open and close), before breakout bar.
Usually if range has already started to move in a bullish direction.
And then a strong Bullish Breakout bar happens, then next fews bars would most likely also go upwards. If not, then it’s a false breakout.
So, keeping close stops will help. And keeping Take Profit at least 1.5-2 times more than stop loss will guarantee good profits.
To get all signals, keep this value to 0-100
Check Tight Range:
If you are only looking for a pattern with a very tight range and then a strong breakout, then keep this setting as true.
And define the Max points for each Timeframe you need. Default settings are not too tight. So will still give good signals.
Use this for calculating points:
Cross Hair Tool For Point Distances

Check Low Volatility Tight Range:
If true, then tight range last bar should have a low volatility, so that a high volatility breakout will be even stronger.
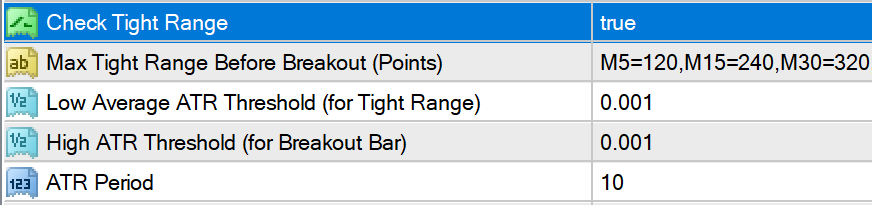
When using Tight Range, you can turn off some settings like Bull Bear Power, volume check, MA stack check, etc.
Because having too many checks on will be very restrictive.
Max tight range is the points value for breakout. If you don’t want this, keep it blank. Instead use ATR.
Low average ATR is for the average of smaller bars in Tight range. And the High ATR is for the breakout bar.
So, it will check that volatility was low when price entered range. And the strong breakout bar had a high ATR threshold.
You can change it to a higher number for really strong breakouts.
NRTR Support/Resistance Settings:
If price is above NRTR Blue Support Line, then it will only show Upward Breakout Signals.
If it is below Red Resistance line, then it will show only downwards breakout signals.
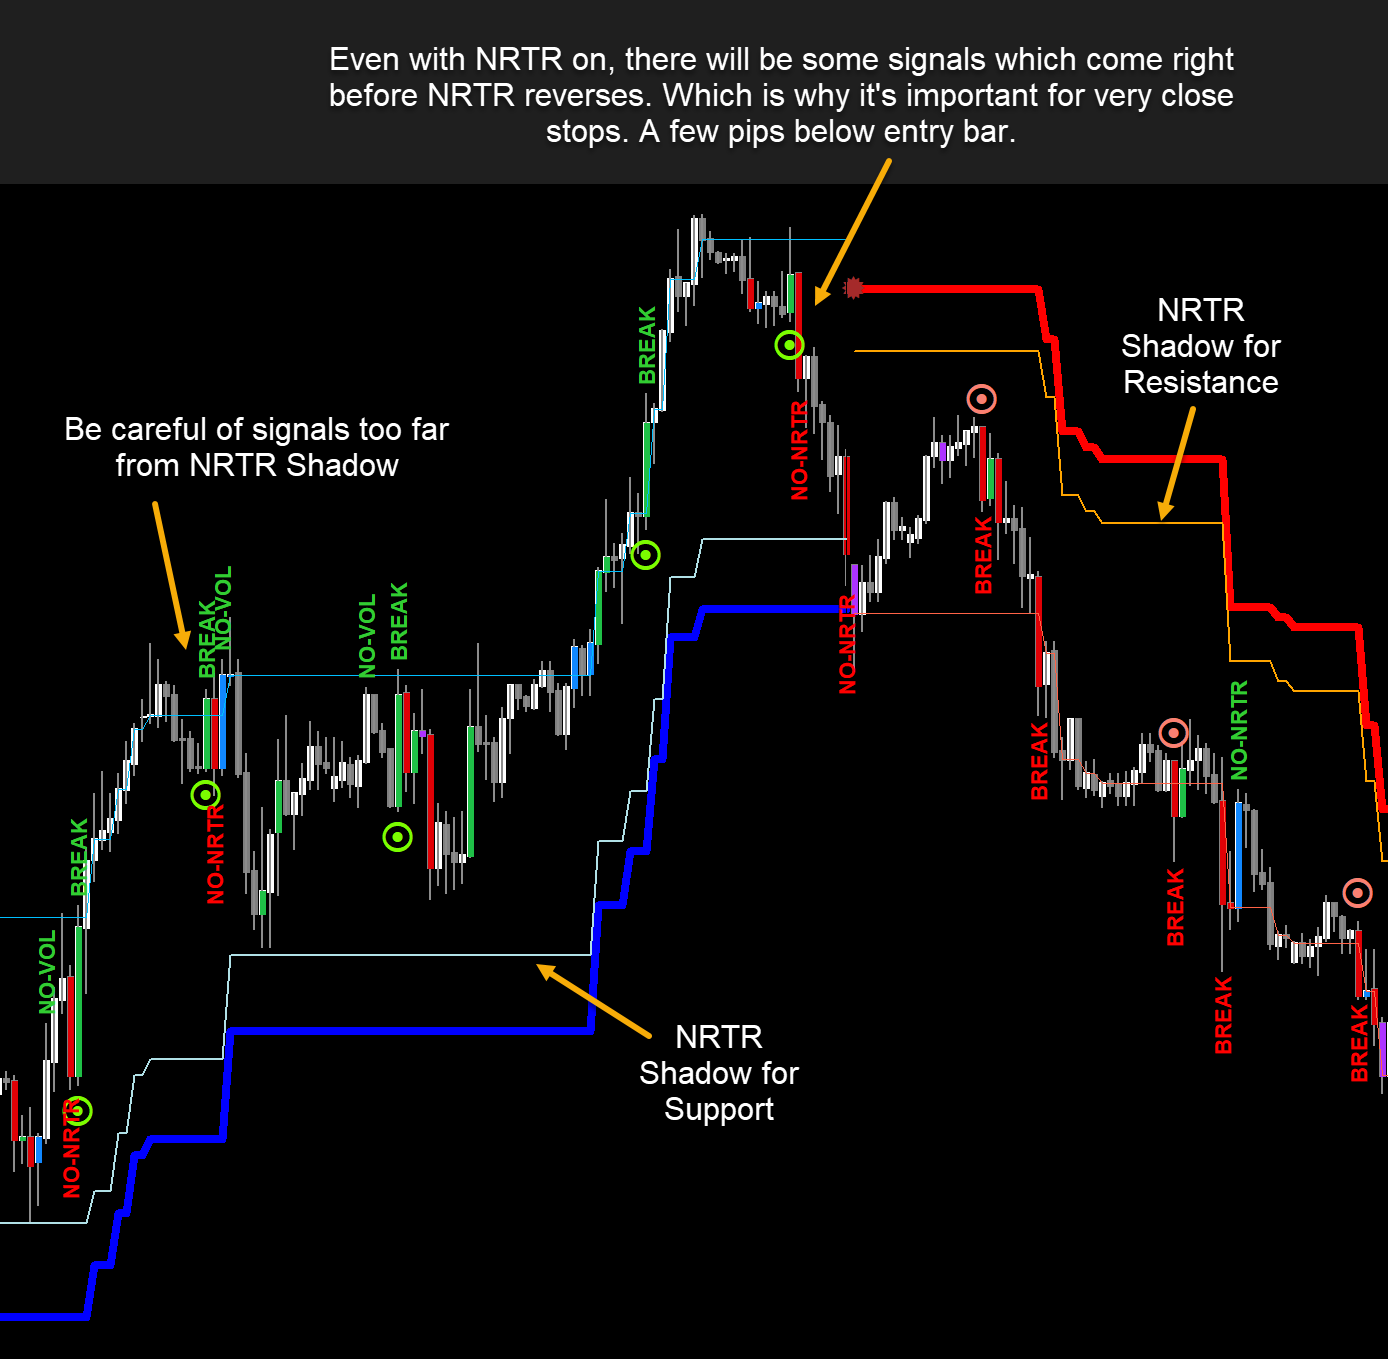
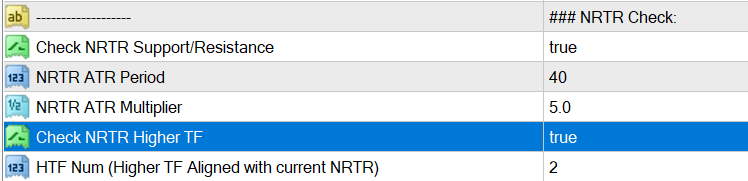
“Check NRTR Support/Resistance” is for current timeframe
But if you need to check for higher timeframes, thne keep “Check NRTR Higher TF” true.
Suppose, you have M15 as current TF and HTF Num is 2. Then it will check NRTR trend on M30 and H1.
If signal is not aligned with higher TF trend, then it will be ignored.
MA Stack Settings:
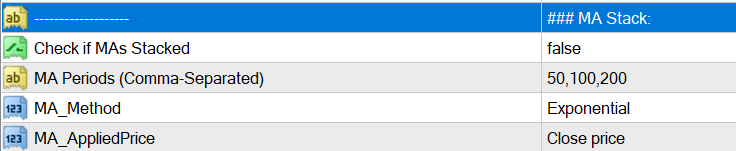
This Breakout strategy also works well when following a good ongoing trend. And finding smaller ranges inside the trend.
So, if you need to find overall trend, you can check if MAs are stacked. Using 5 MAs like default settings: 8,21,34,55,89
This will give you fewer signals. Because all 5 MAs to be stacked can be rare. So, only use this if you want to trade highly trending pairs.
As it will skip signals when price is in smaller trends or ranges.
Or else, use fewer MAs like: 8,21,34
Or use higher MAs to find overall higher trend like: 50,100,200
This will all depend on your style of trading. If you are quick scalping, only a few bars, then keep it off.
Because it takes time for trend to be established, and then MA Stacking happens. So, use it when you need to trade trends.
Use Abiroid MA Stack.ex4 indicator for MA Stack visualization:
High/Low Detection:
Instead of NRTR or MA, you can also check how many higher highs and Lower lows price has been making. For an up trend, if price has already made 2 or more higher highs, then price is still in a good strong Up Trend. Same for a down trend Lower Lows and Lower Highs are important.
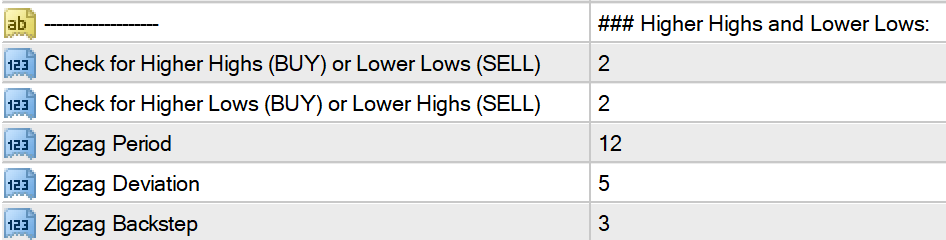
Keep “Check for Higher Highs and Lower Lows” to 0, to disable the checks. Same keep other “Check for Higher Lows or Lower Highs” to 0 to disable.
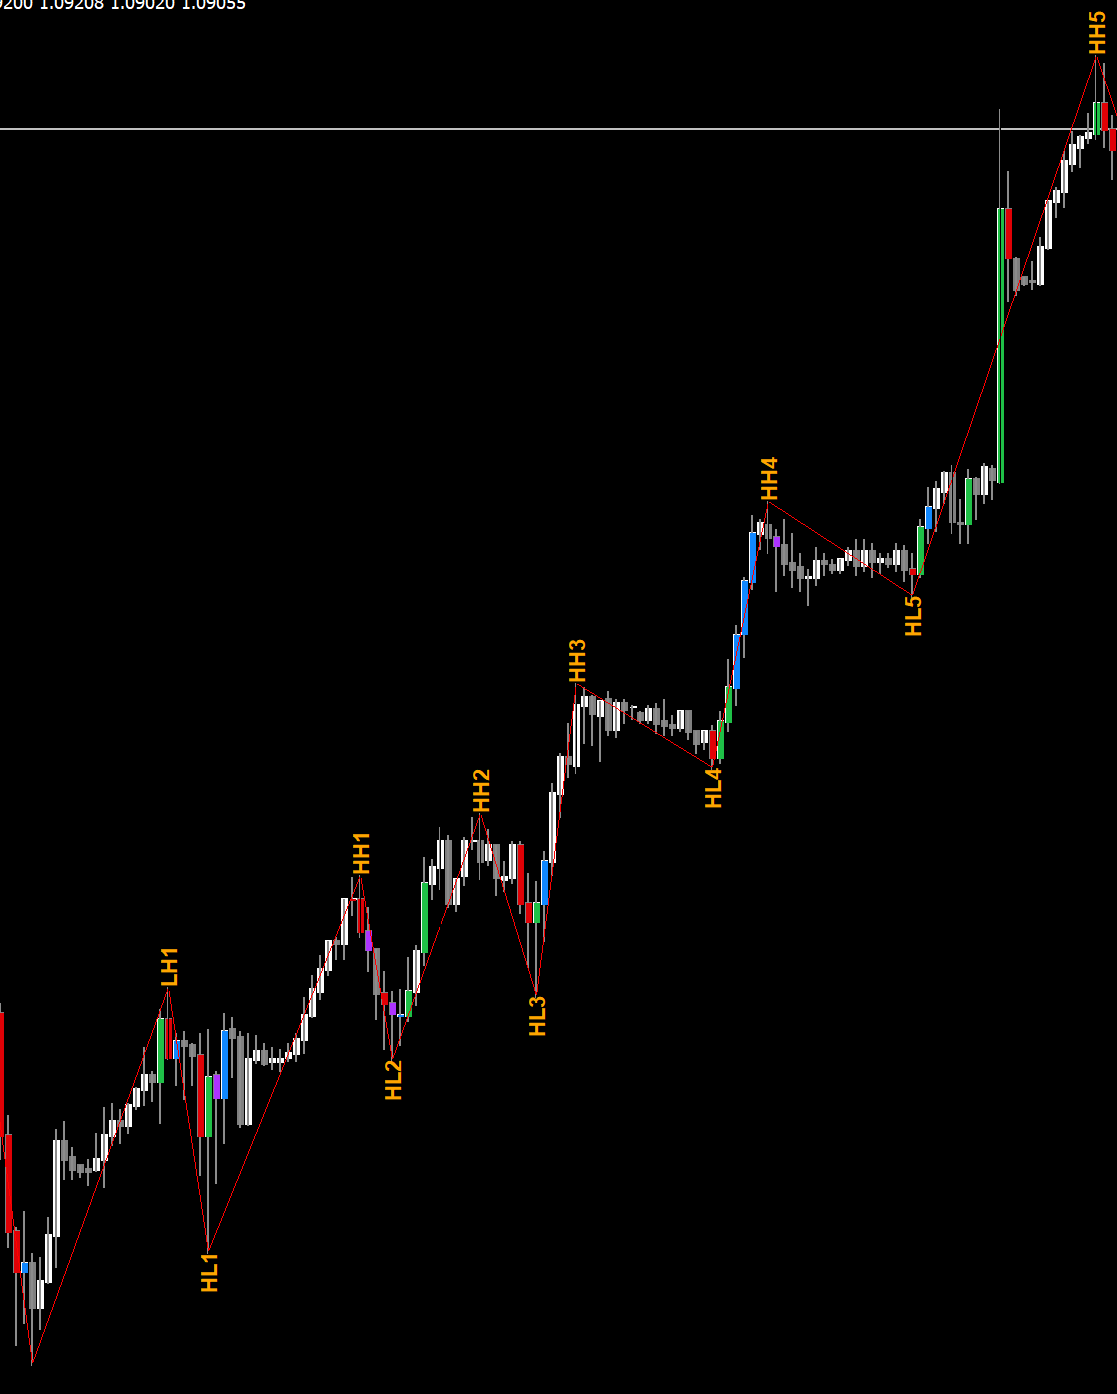
To visually see the counts for reference, get the High Low Count Indicator here. But it’s not necessary for this Range Breaker to work. It’s in-built and will work internally.
Abiroid ZigZag High Low Counter
Volume and Volatility Settings:
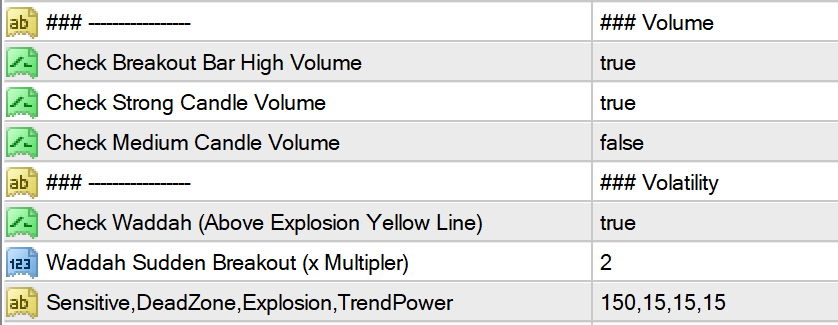
If the breakout candle is a high volume and high volatility candle, then there is a greater chance of next few bars going in the same direction.
Which is why, when quick scalping just a few bars, you can keep these to true.
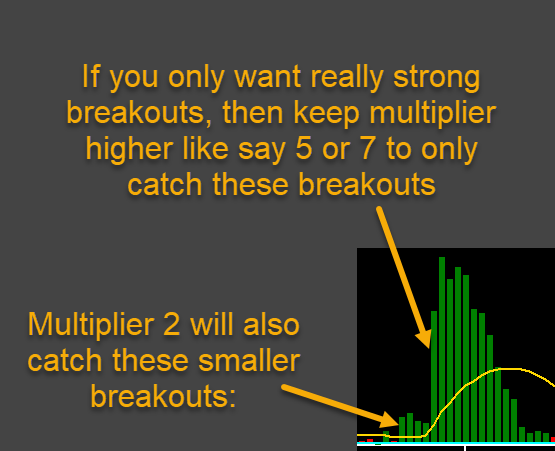
Waddah Explosion:
Waddah Sudden break will use a Multiplier to check breakout strength. If the Green/Red waddah bars are xMultiplier times greator than the yellow explosion line.
In image above Multiplier is 2. So for BUY, it will check if waddah green histogram is 2 times more than the yellow explosion line:
Waddah Explained:
https://abiroid.com/waddah-attar-explosion-for-scalping/
It uses this indicator for Volume:
And Waddah for Volatility check:
Max Spread:
Since this is a quick scalping strategy, it’s important to only trade pairs with a very small spread. To minimize losses.
![]()
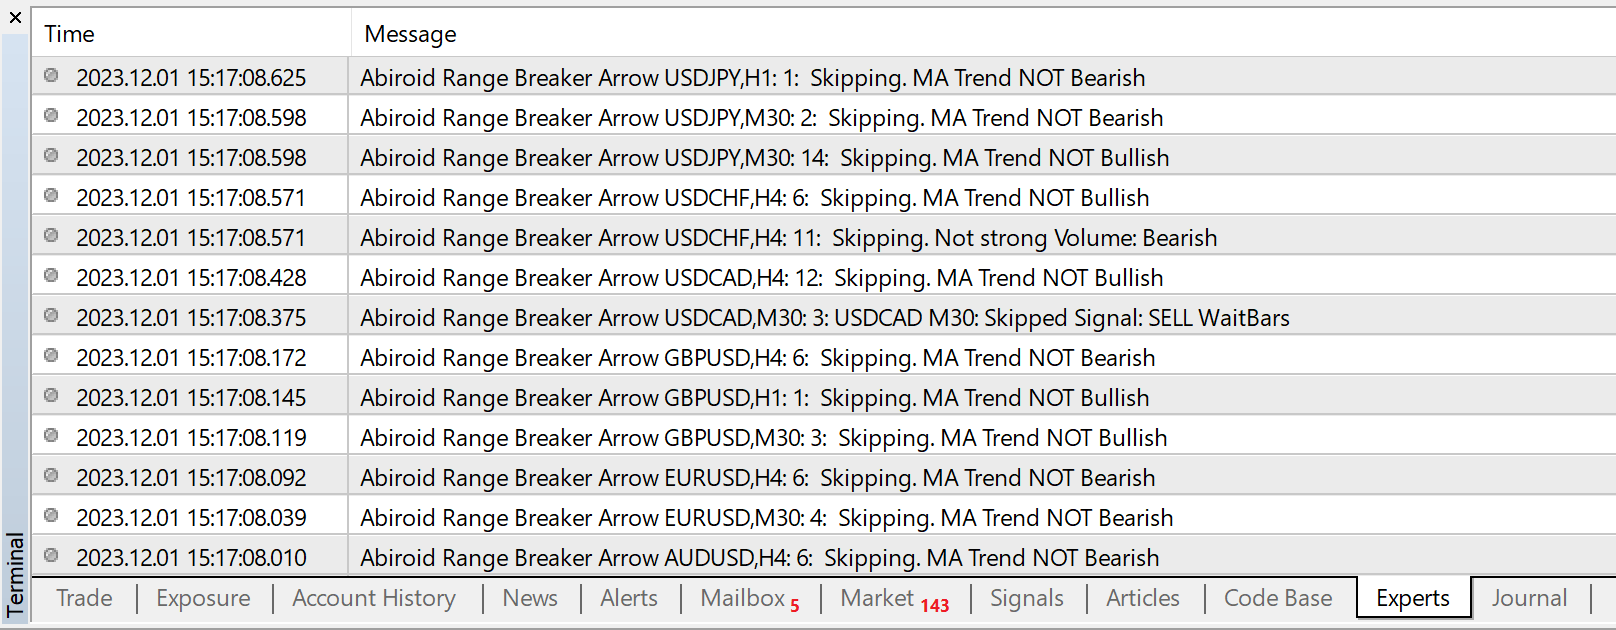
e.g.: If Max Spread is 15, then all pairs above spread 15 will be ignored. Check the detailed Experts tab logs to see why a signal is ignored:
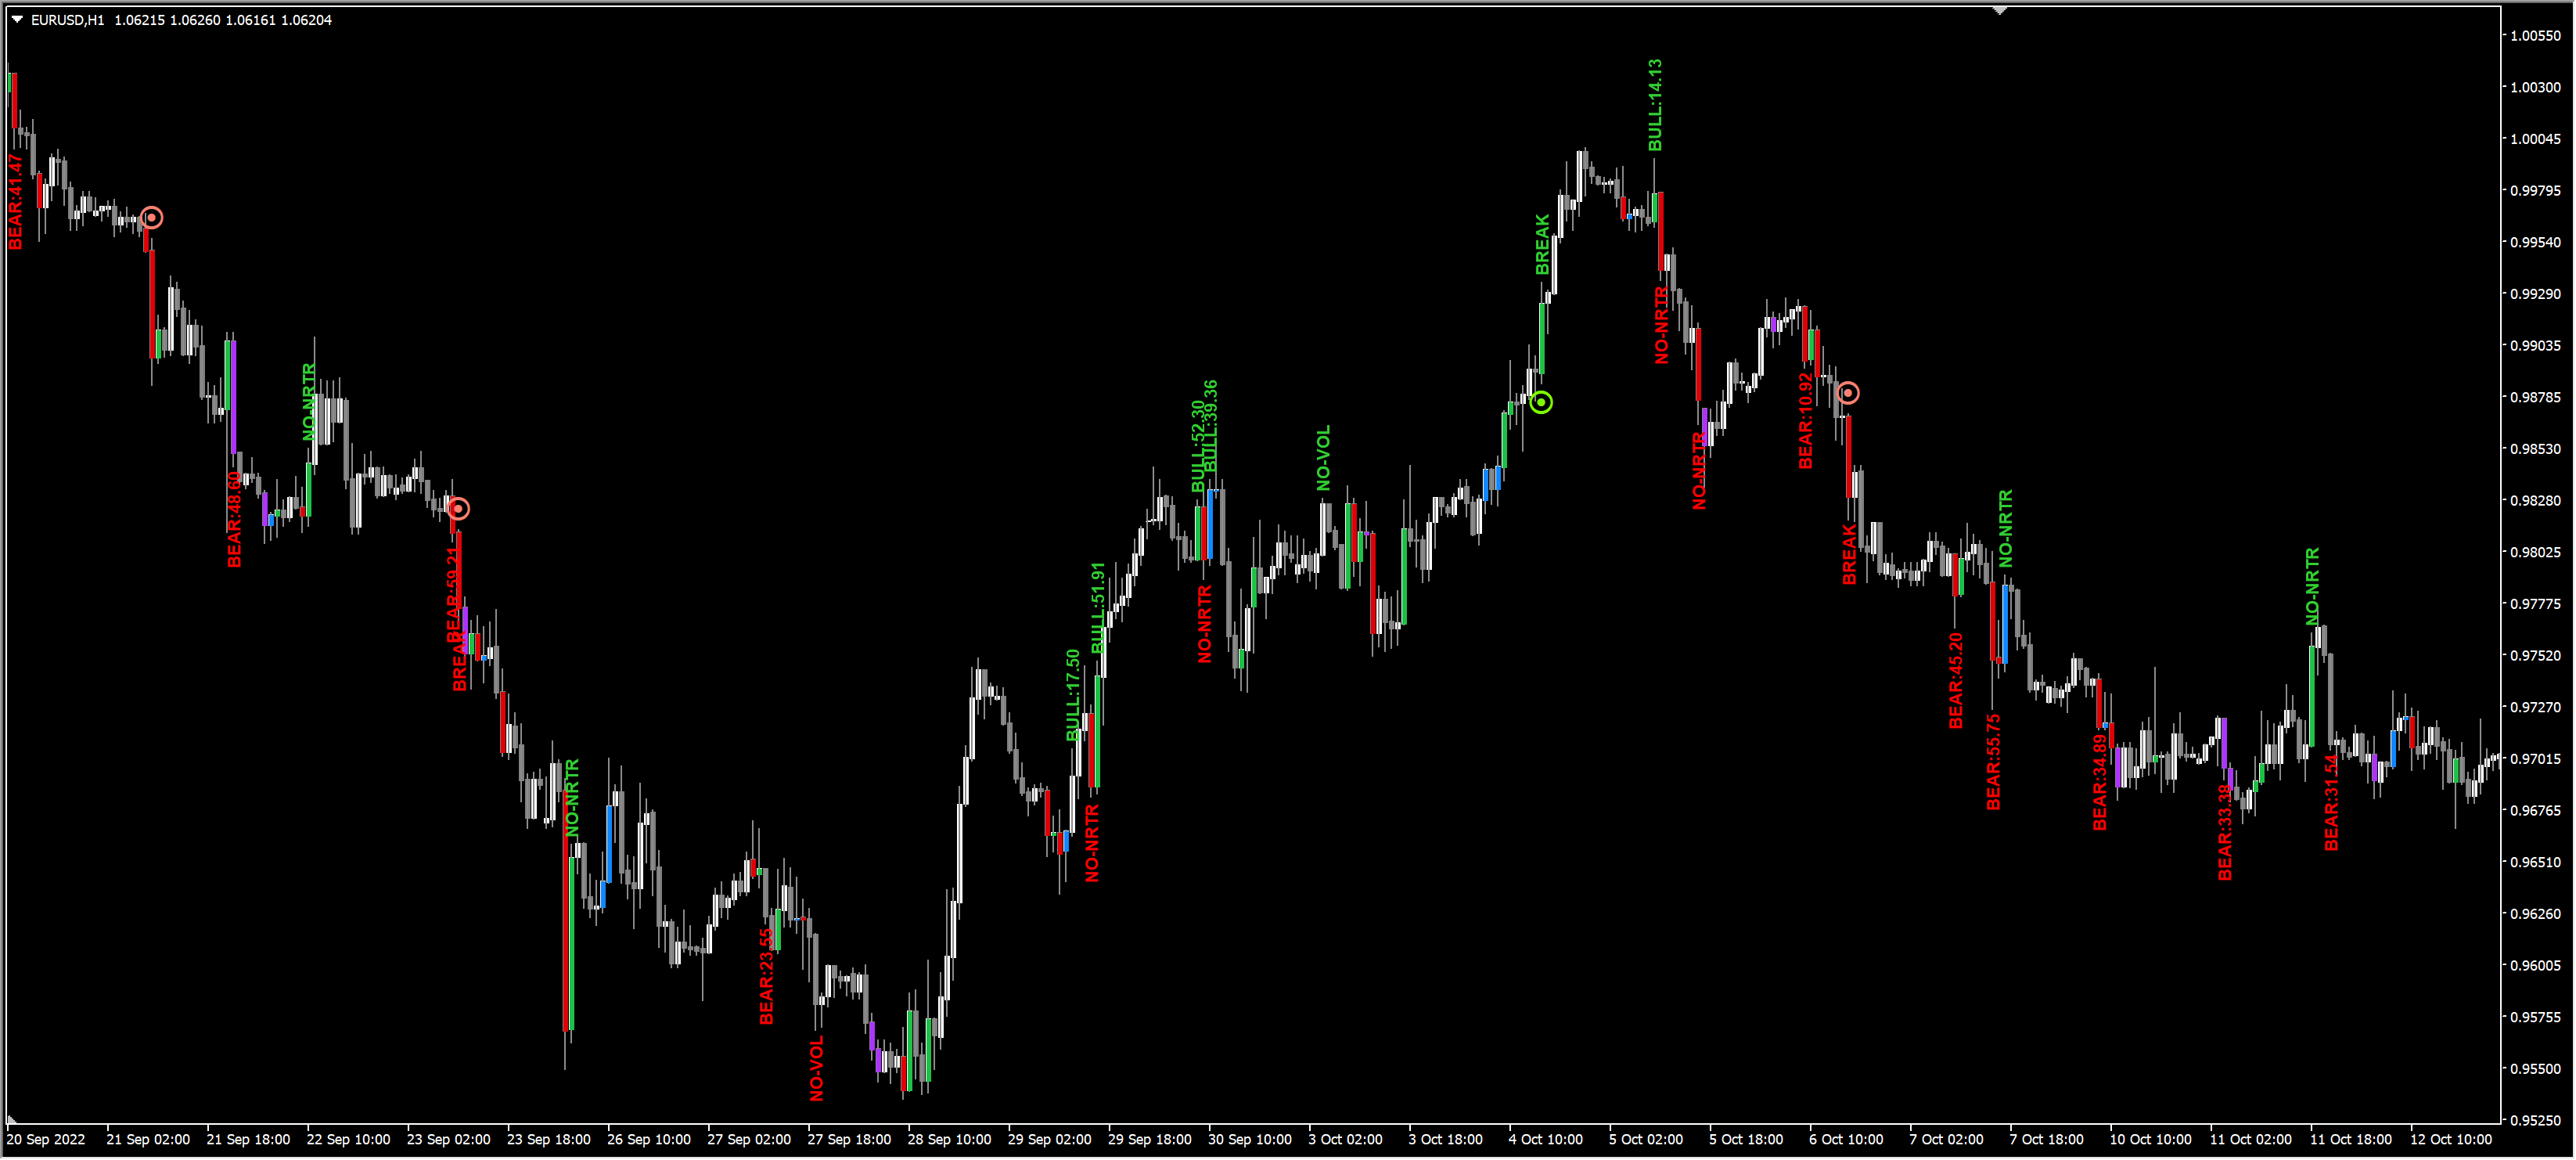
Debug Messages:
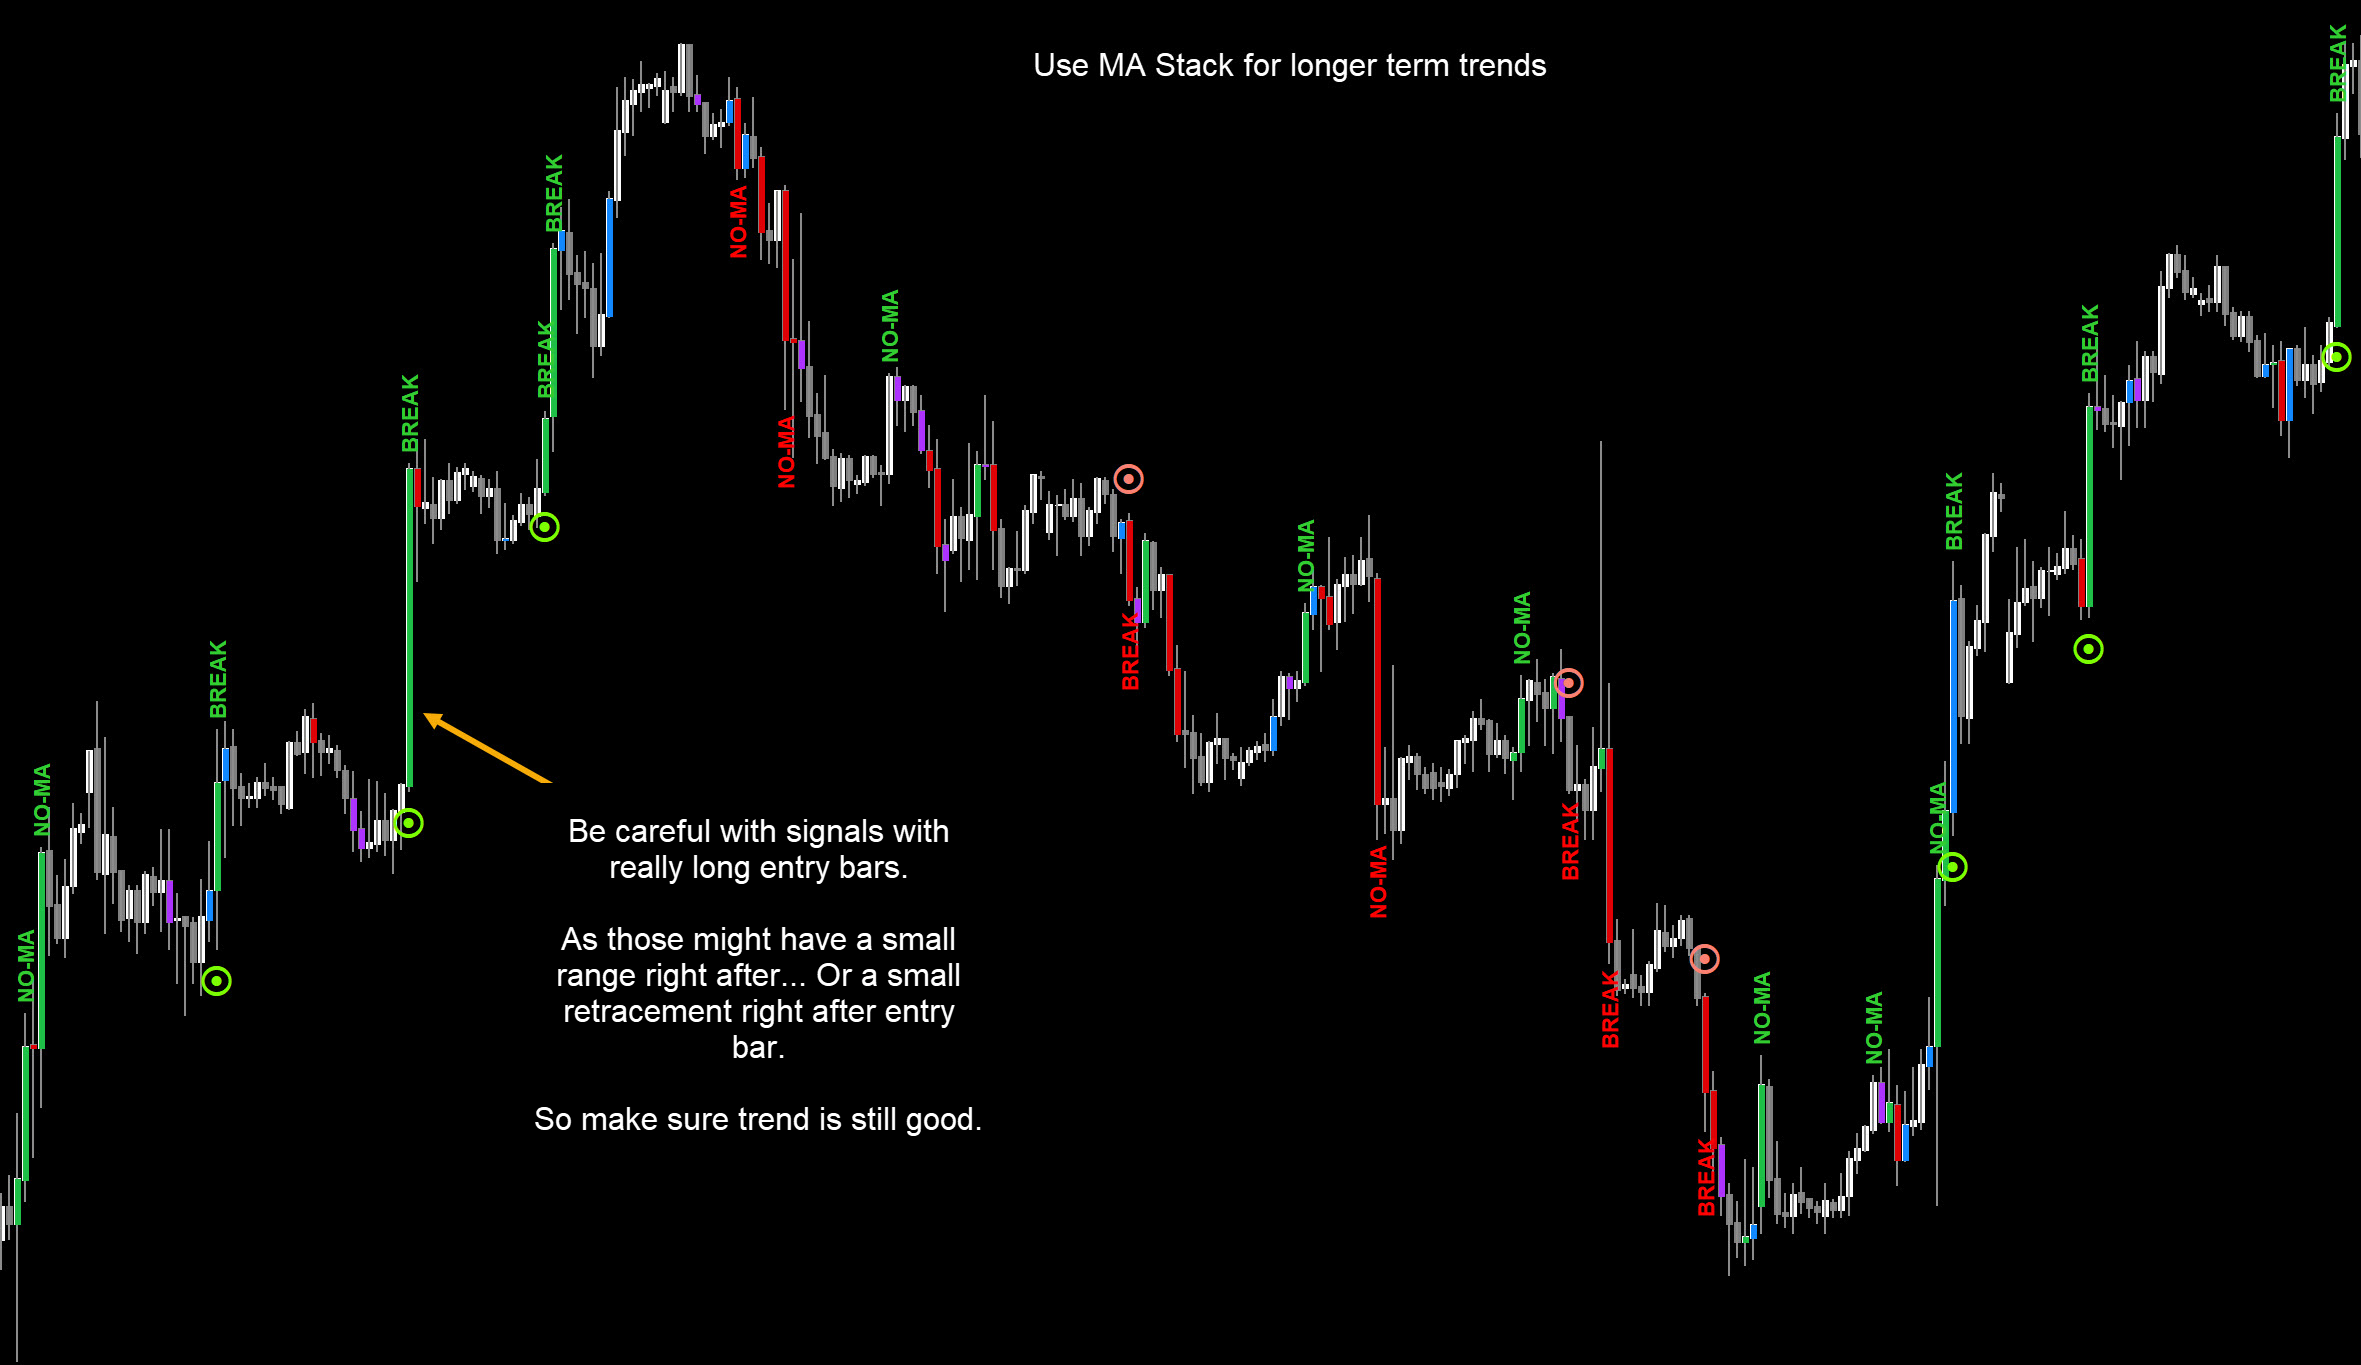
BREAK: A breakout is detected on a bar. Next it will check more filters
Skipping signals because of Filters:
NO-MA: MA Trend is not towards Breakout bar’s direction. Or MAs are not spread out and stacked yet
NO-NRTR: Current Timeframe NRTR Trend is not in breakout bar’s direction
NO-NRTR-TF: Higher Timeframe’s NRTR Trend is not aligned with breakout bar’s direction. It will be shown as NRTR-H1 for HTF H1 and so on…
BULL: % Bullish Percentage is lower than threshold. Suppose threshold is 60-100% then the debug message will show how much it actually is.
BEAR: % Bearish Percentage is lower than threshold.
NO-VOL: Breakout bar is not High/Medium volume bar
NO-WAE: Breakout bar is not High Volatility Bar
NO-HH, NO-LL, NO-HL, NO-LH: Not enough Higher-Highs OR Lower Lows, OR Higher Lows, OR Lower Highs according to defined values
Skipping Signals because of Tight Range:
TOO-LONG: Breakout Bar is longer than xMultiplier “Breakout Bar Max Length”.
NO-TIGHT: Past range bars total height is not less than the Tight Range Max height defined for that timeframe
NO-RANGE-ATR-LOW: Past range bars average ATR is not LESS than “Low Average ATR Threshold”
NO-BREAK-ATR-HIGH: Breakout bar’s current ATR is not MORE than “High ATR Threshold”
You’ll also see all reasons of why a signal is skipped in your Experts Tab logs:
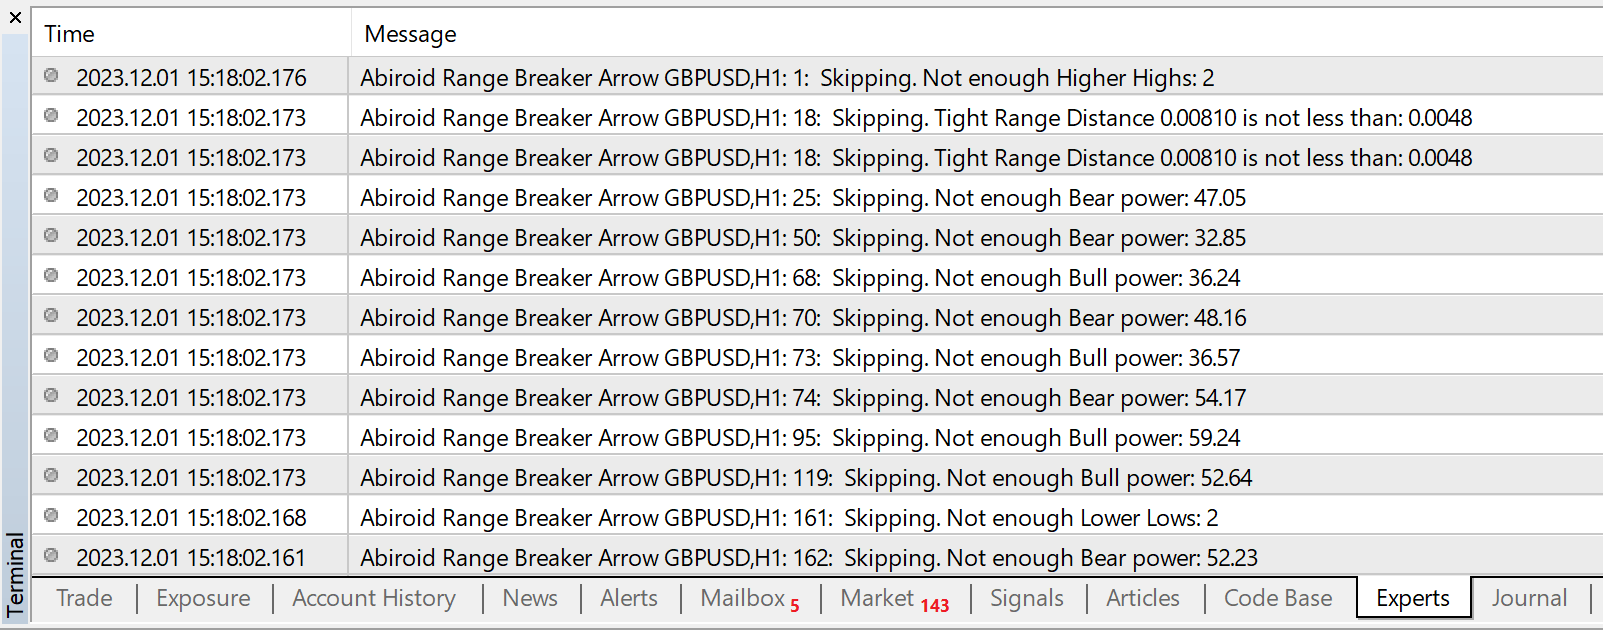
Same for scanner, if Show Detailed Journals Log is true:
Just turn “Show Debug Bar Numbers” true temporarily in Arrows indicator. To see which bar has skipped signal and match it in the logs.
Changelog:
v1.0 Base version
v1.1 Fixed debug messages. Added more debugs in logs.
| mql_site_link |
|---|
Related products


Abiroid Auto Fibo Indicator
- Blue Diamond if price Price crosses towards Trend
- Orange Diamond if price reverses towards retracement


ProfitPercent Arrows MA Confluence
- Main Signal Indicators (Any One): MA Cross (In-built) or Hull, OBV Cross, Heiken Ashi Cross
- Validation Indicators (Preferably less than 3): OBV (with Min Distance), Heiken Ashi, ADX, SuperTrend, PSAR, Higher TimeFrame EMA Alignment
- If MA Cross and OBV Cross both are false, only then Heiken Cross will be taken as Main Signal.

