Abiroid Fibo and Pivot Scanner with Missed Pivots
40 $
Buy from MQL5- Select separate Pivot Timeframes for each Dashboard Timeframe
- Check when price is near a Pivot point
- Check for Price Crossing Pivot Point
- Use Mid Pivots (Optional)
- Show Missed Pivots (Optional)
- Show High Volume Bar
- Use Fibo (Optional)
- Use Fibo Golden Ratio (Optional)
- Set your preferred Timeframe for Fibo or Pivots
All products are non-refundable. Since these are digital products. No source code available, only executables. Please read product description carefully before buying.
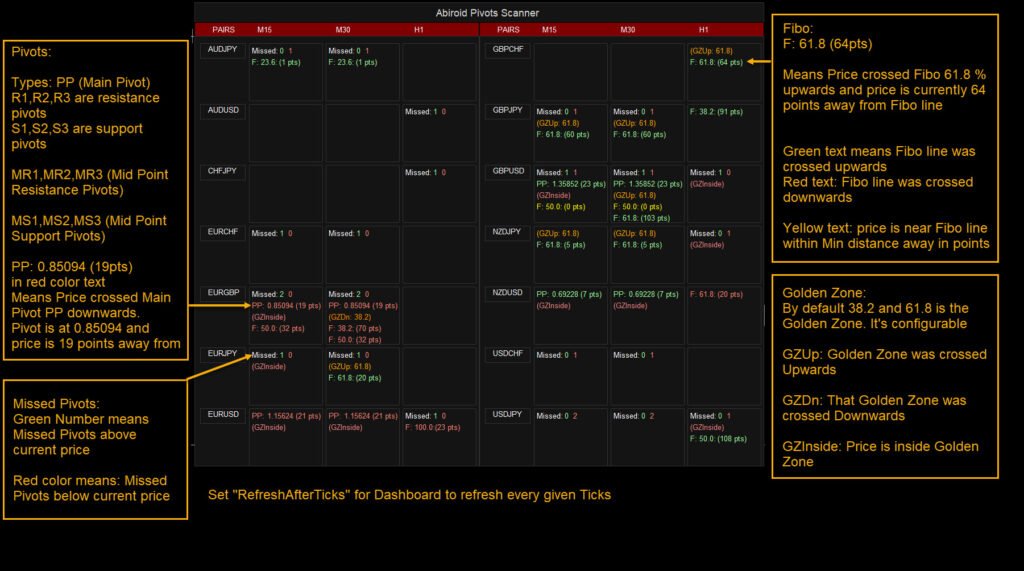
This is a multi-timeframe multi-currency Fibo (Fibonacci levels) and Pivots scanner dashboard which also shows Missed Pivot count and Fibo Golden Ratio Zones.
Features:
- Select separate Pivot Timeframes for each Dashboard Timeframe
- Check when price is near a Pivot point
- Check for Price Crossing Pivot Point
- Use Mid Pivots (Optional)
- Show Missed Pivots (Optional)
- Show High Volume Bar
- Use Fibo (Optional)
- Use Fibo Golden Ratio (Optional)
- Set your preferred Timeframe for Fibo or Pivots
Extras:
Use a Pivots Points indicator which allows you to set Pivots Timeframe. Like this one:
Settings:
Check out Common Scanner Settings here:
https://abiroid.com/indicators/abiroid-scanner-dashboard-common-settings
Dash will refresh every “Refresh After Ticks” number of Ticks. Default is 50. Which during high volatility times is about 7-8 seconds.
Don’t set this number to too low. Because it will get too many refresh requests, before previous refresh has completed. And so, dash might hang.
Pivots Scanner specific Settings:
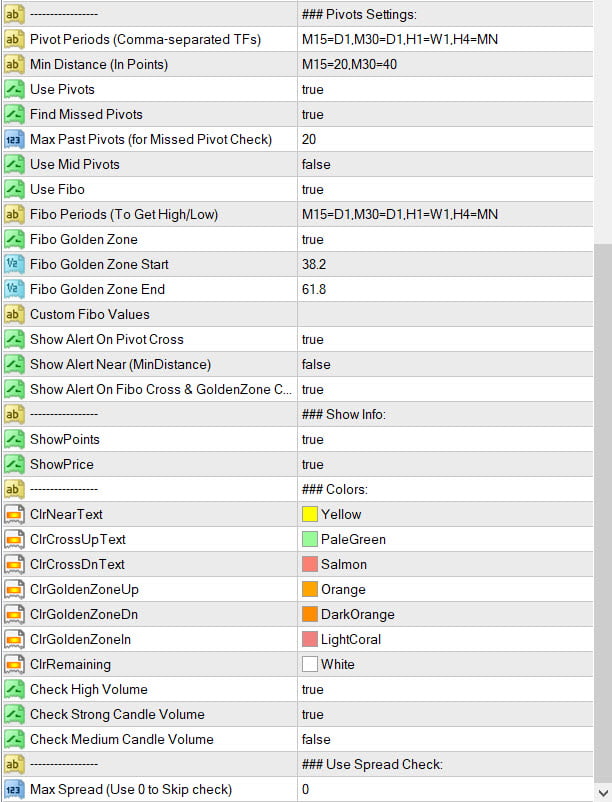
- Pivot Periods (Comma-separated TFs)M15=D1,M30=D1,H1=W1,H4=MN
means for M15 use Daily (D1) Pivots, for M30 also use Daily (D1). For H1 use Weekly (W1) Pivots and for H4 use Monthly (MN) Pivots.
- Same way for Fibo Periods for Fibo High/Low detection
Suppose M30 has Fibo Period of D1, then it will look back for all daily bars to find the highest high and lowest low and the Fibo will be drawn for that.
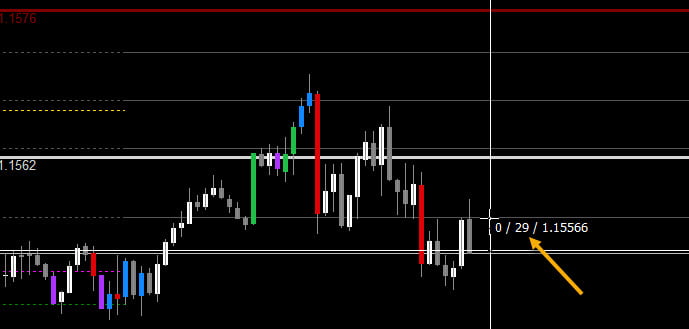
- Min Distance is in Points. To find Min Distance in chart use the cross hairs tool:
The second number in crosshairs tool shows points distance. If you specify Min Distance M30=40 and if price is at distance 29, means the scanner will show the Pivot as nearby.
- Fibo Golden Zone: By default Golden zone is between 38.2% and 61.8%. But you can modify these to any Fibo level you like.
- Custom Fibo Values:
Default Fibo values are:
- Alerts: Show Alert on:
- Cross: Pivots or Fibo or Golden Zone
- Price Near Pivots (within Min Distance)
- Text Colors are customizable
- High Volume Bar: If true, show (V) for high Volume bar
How to Trade:
This Scanner is to be used with your existing Pivots/Fibo Strategies.
For scalping you can trade retracements or trends. But for longer term trading, always trade trends.
Be careful when market is whipsawing, e.g. near news events. Also be careful if volatility is too low and price is stuck near a Pivot/Fibo level for a long time.
Wait for a good volatility time.
Be aware of High Volume bars breaking through Pivots/Fibo.
Because a strong bar crossing a Pivot or Fibo means the Pivot or Fibo is probably broken.
If bar goes too far, like if it crosses multiple Fibo levels, then it will retrace a little and then keep following the trend. So, always wait for retracements.
And keep Buy or Sell Limit orders near the Pivot which is broken. Because price usually retraces back after breaking a level.
| mql_site_link |
|---|


