


TDI Sharkfin Arrows and Scanner
30 $
Buy from MQL5- Sharkfin Arrows
- Sharkfin Scanner
- SM TDI: To show TDI lines with sharkfin levels
- Zigzag MTF: To see Higher Timeframe trend
All products are non-refundable. Since these are digital products. No source code available, only executables. Please read product description carefully before buying.
This product contains TDI Sharkfin’s scanner and arrows indicator. And also a TDI version which makes it easier to see Sharkfins on chart.
Scanner is multi-timeframe and multi-currency. Arrows works on a single timeframe and single currency. But it’s visually helps see that sharkfins.
Scanner (Paid):
https://www.mql5.com/en/market/product/123566
Arrows (Free):
https://www.mql5.com/en/market/product/42405
Sharkfin Pattern happens when price suddenly rises and then quickly starts dropping, or suddenly drops and quickly starts rising:


When this happens, the RSI Price Line (green) will cross the overbought line and go below it quickly, creating a sharkfin like pattern.
Same for when price crosses oversold lines and back quickly inside. After a sharkfin, price will continue going in same direction for next few bars and so we can trade this pattern with a lot of success.
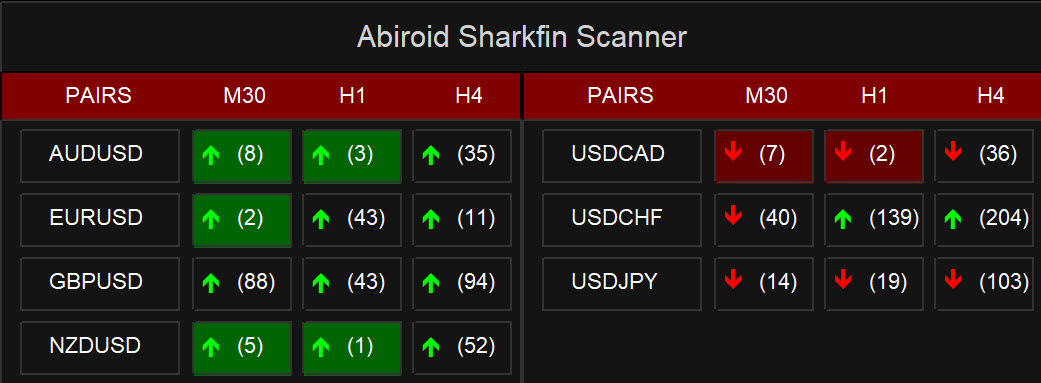
About Scanner:
It is a very simplified scanner.
It will show when a sharkfin up/down arrow signal and will also give alerts. And brackets show how many bars back the signal had happened.
Read more about common dashboard settings here:
Abiroid Scanner Dashboard Common Settings
For a much more detailed TDI Scanner, check out the product here:
About Arrows:
Sharkfin Arrows indicator will only show Up/Down arrows. And you can use it’s buffer values 0 and 1 in case using it with an EA.

Downloads:
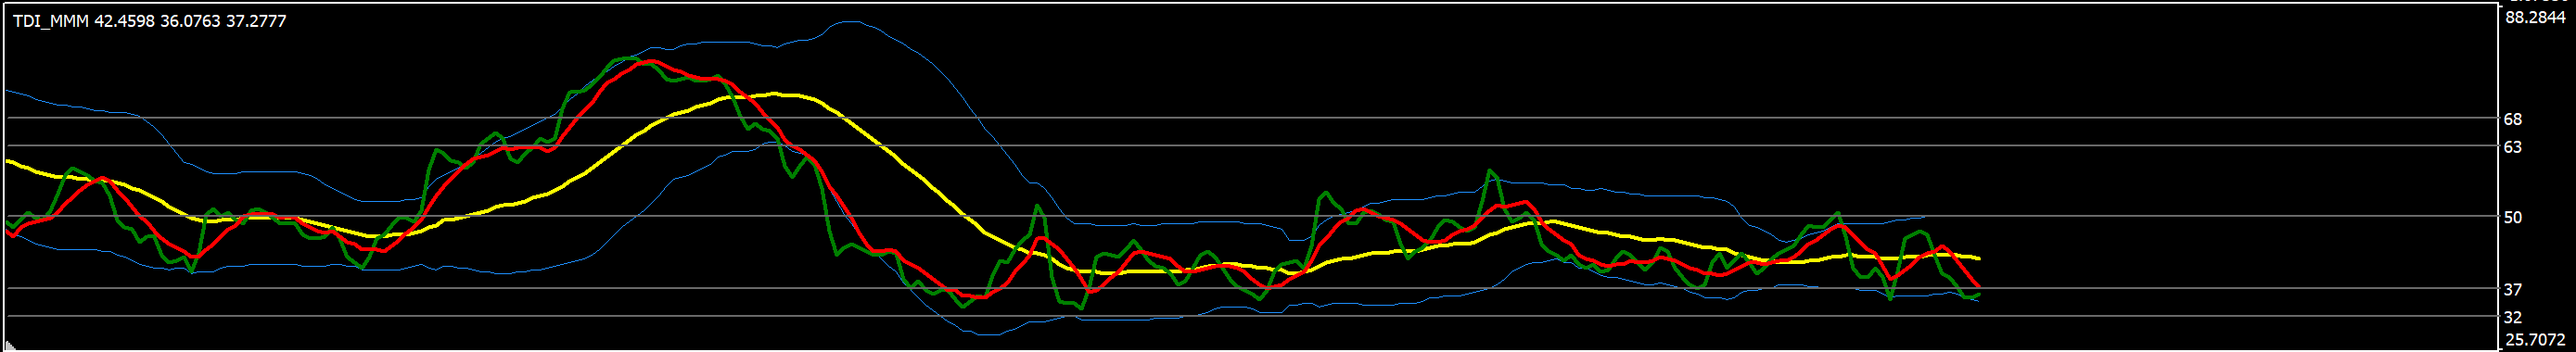
SM_TDI:
It is a modified TDI with extra levels which help you see sharkfins better:
Zigzag MTF for HTF Trend:
What is Shark Fin TDI Pattern?
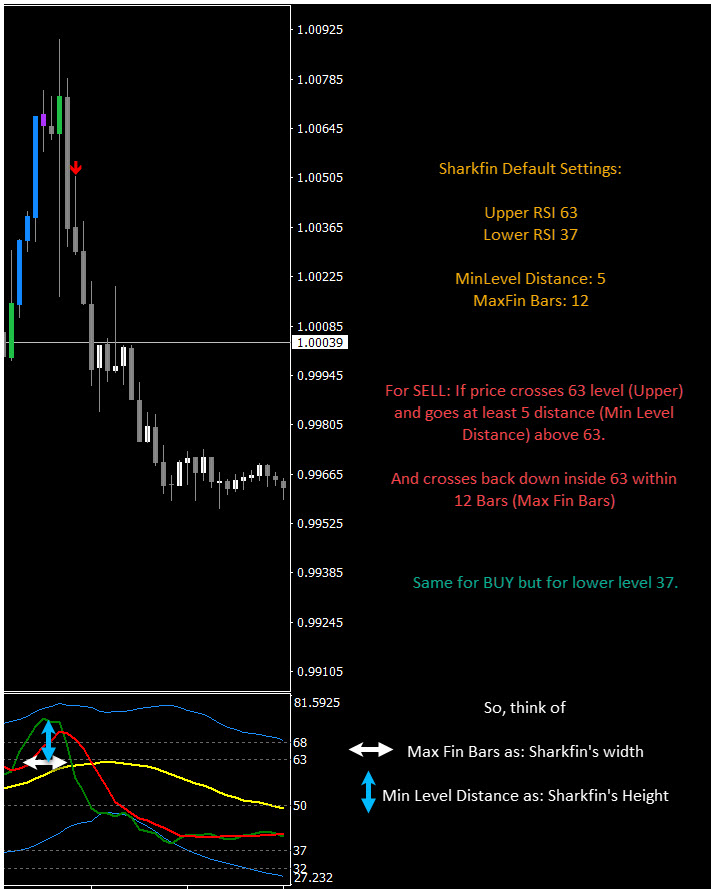
Upper Shark Fin: In TDI Indicator when Green RSI Price Line breaks above a certain level and also breaks upper Volatility band and then breaks below that level, then a shape resembling a Shark’s fin is formed.
RSI follows the price. This pattern indicates that RSI Price Line rose suddenly and fell, means price will most likely keep falling further and so it’s a good time to make a SELL.
For BUY Signal, it’s an inverted shark fin.
Indicator Properties:
- RSI Settings: Period, Price, Line, Line Shift, Volatility bands, Price Type, Overbought, Oversold
- SharkFin Settings:
- SharkFin Levels: Upper and Lower RSI Levels
- Sharkfin UseVolBands: If set to false only use Upper and Lower SharkFin Levels
- MinLevelDist: Min distance from Upper/Lower Level, that RSI should reach for it to be a valid sharkfin
(example: If Upper Level is 63 and MinLevelDist is 10, then for a valid sharkfin the RSI should reach at least 73)
- MaxFinBars: Max bars within which the Sharkfin should get resolved.
(example: If MaxFinBars is 10 and if Upper Level is 63, then RSI should go above 63 and come below 63 within max 10 bars)
Other Settings:
- MaxPastBars: Total previous bars for which SharkFin is calculated. Default 5000
- ShowAlerts: Show Popup alerts when SharkFin is detected or not
How to use it and Optimize settings?
Apply indicator to chart and also apply a TDI indicator. You’ll see Sharkfins forming in the TDI.
Change MinLevelDist and MaxFinBars values and see which types of Sharkfins you need to detect.
Keeping lower MinLevelDist and higher MaxFinBars is great for scalping. But for longer trading on higher frames set these values to default. Otherwise you’ll get too many unreliable signals. Also, for scalping you can keep Use Volbands to false. To get more signals.
Always trade in direction of higher timeframe’s overall trend.
Scalping Example:
On H1, price seems to be making long ranges sideways:
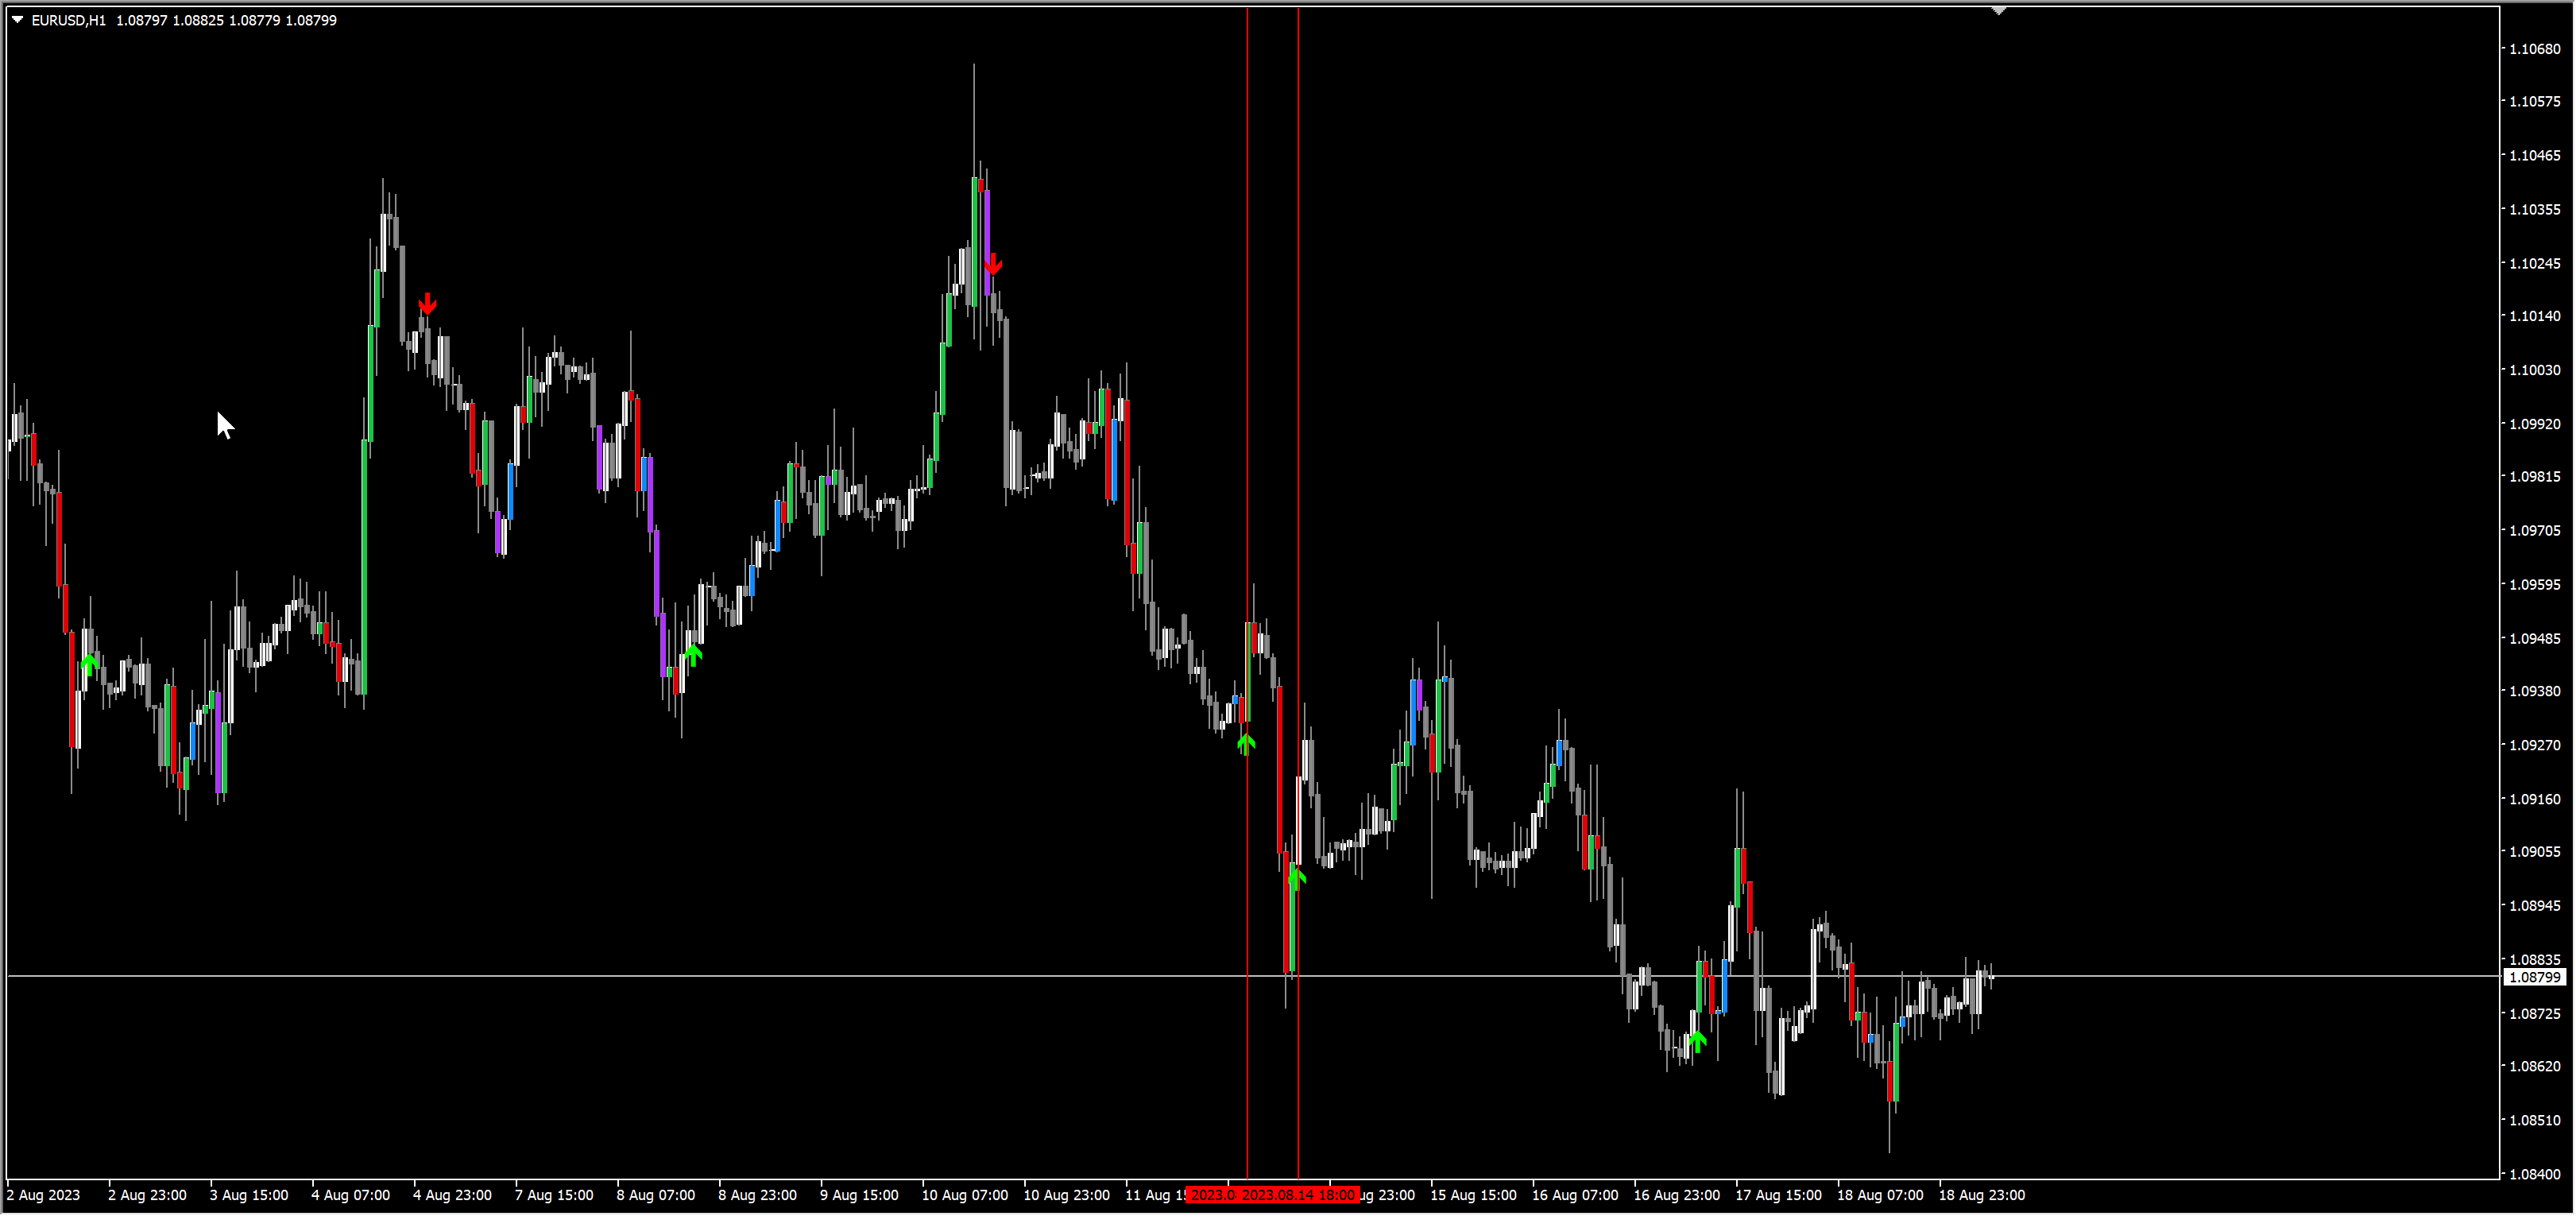
But on H4 price is in overall downtrend. See the corresponding red vertical lines. Where up signals happened.
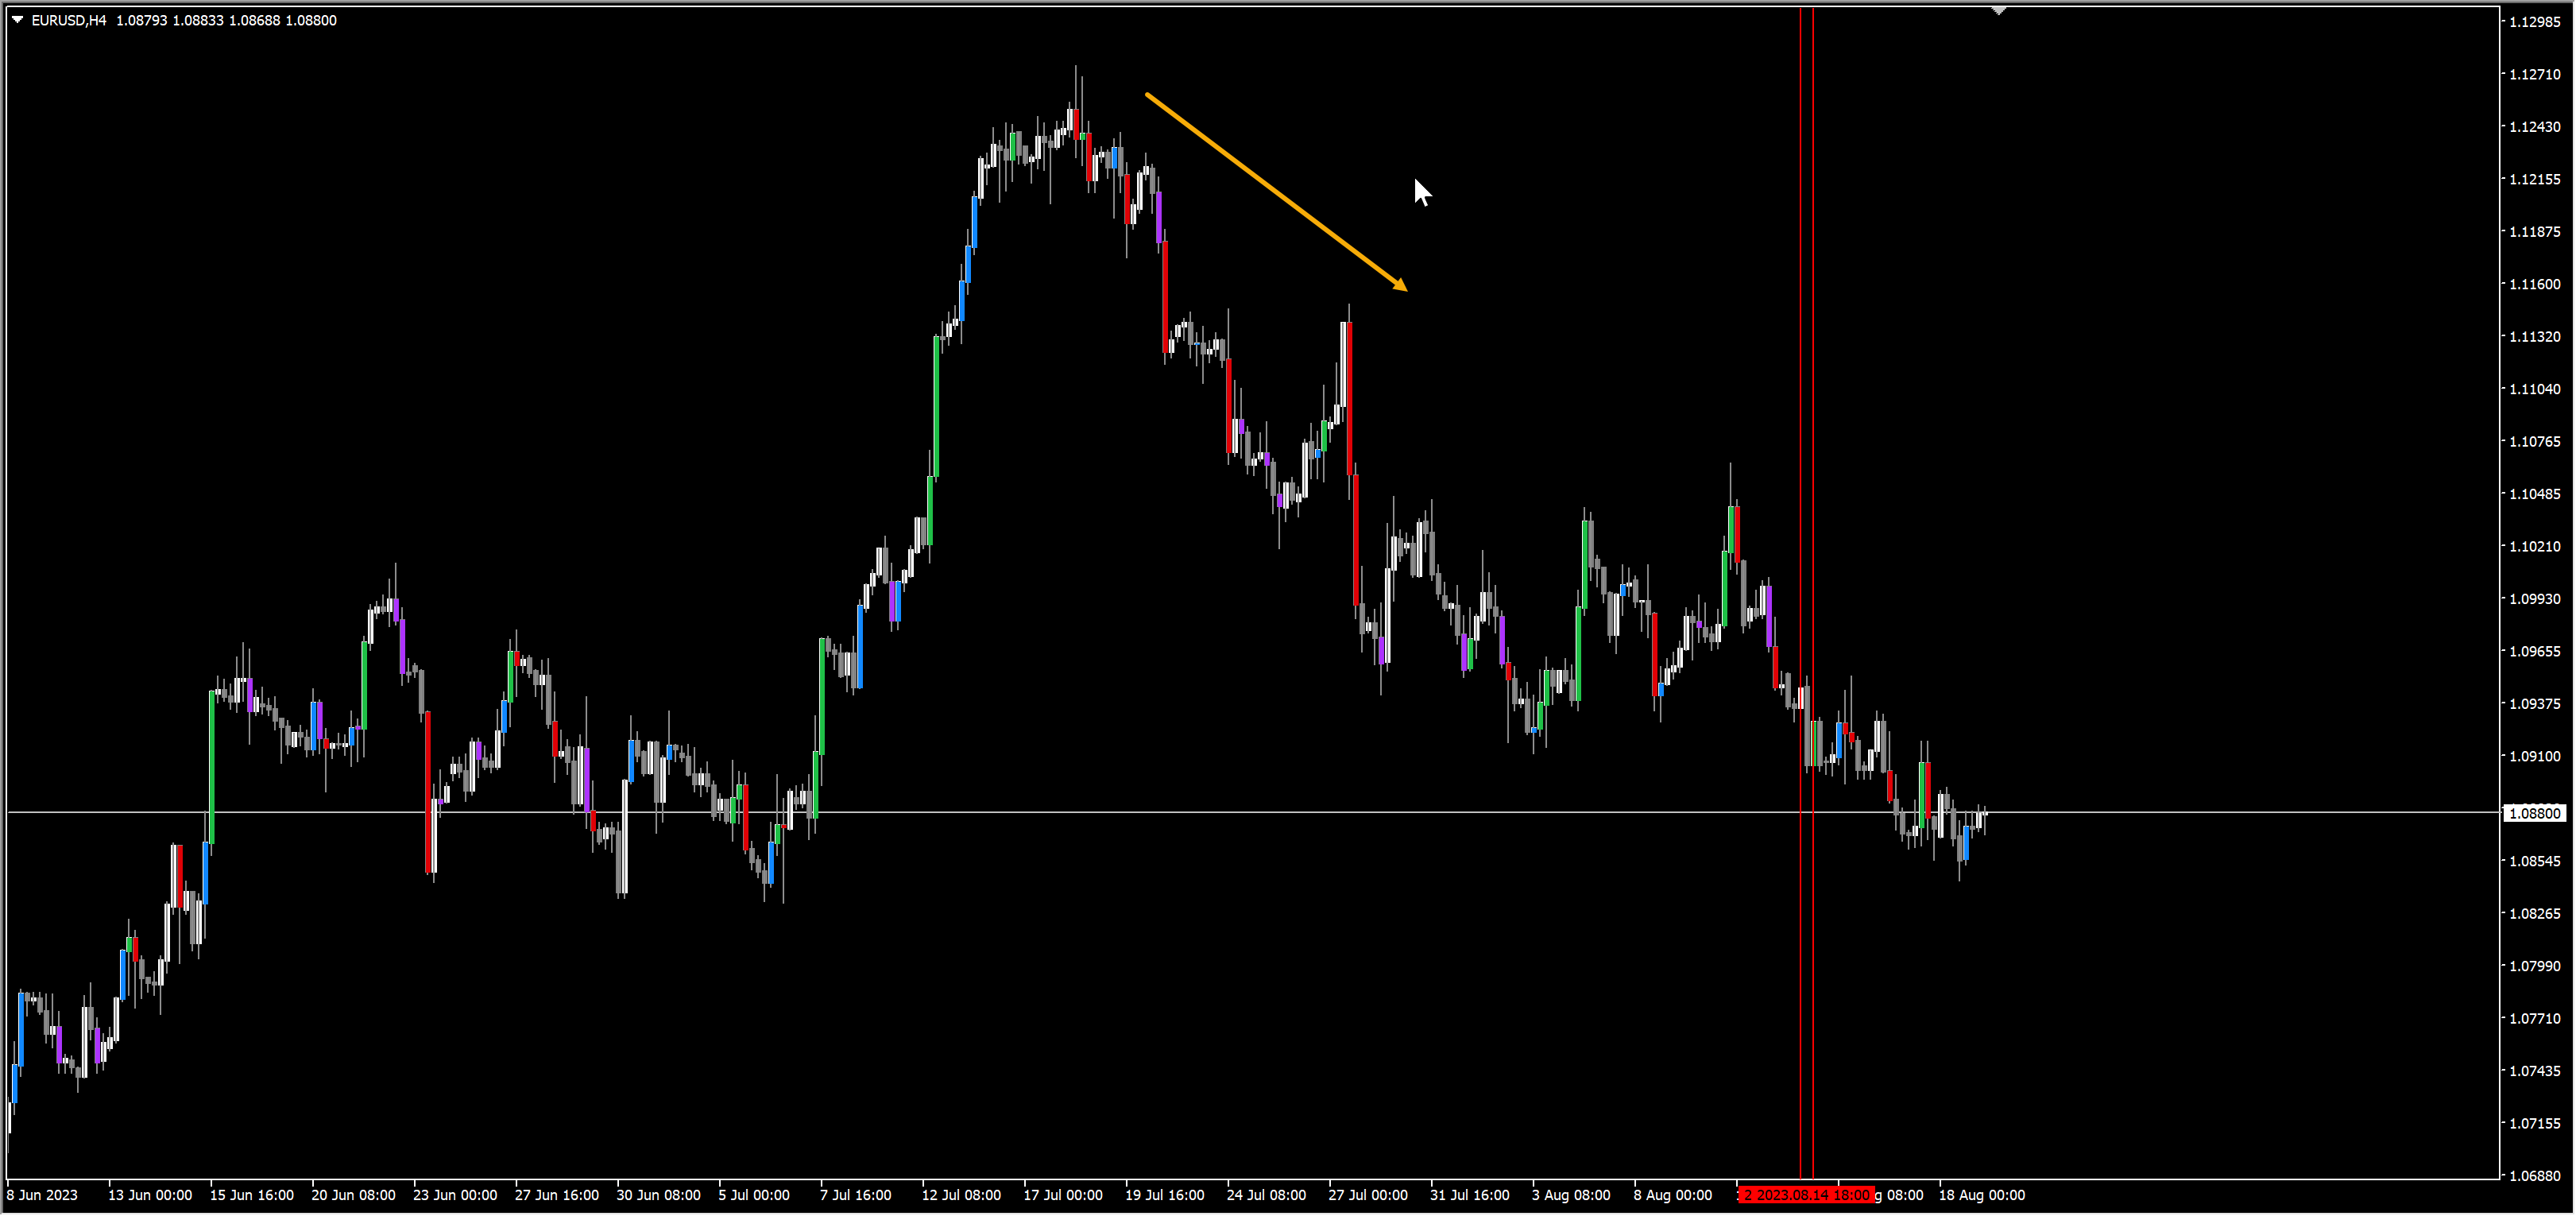
In this case, it’s not a good idea to trade up signals. As profit won’t be much. Because HTF (H4) is clearly in a downtrend.
So, always visually check higher timeframes for overall trend. By drawing vertical lines at signal arrows.
And set Take Profits using Pivot points for best success. The pivot should be near when price had first started rising or falling.
Changelog:
v1.3 Scanner base version
| mql_site_link |
|---|
Related products


Abiroid Fibo and Pivot Scanner with Missed Pivots
- Select separate Pivot Timeframes for each Dashboard Timeframe
- Check when price is near a Pivot point
- Check for Price Crossing Pivot Point
- Use Mid Pivots (Optional)
- Show Missed Pivots (Optional)
- Show High Volume Bar
- Use Fibo (Optional)
- Use Fibo Golden Ratio (Optional)
- Set your preferred Timeframe for Fibo or Pivots

Abiroid Auto Fibo Indicator
- Blue Diamond if price Price crosses towards Trend
- Orange Diamond if price reverses towards retracement


ProfitPercent Arrows MA Confluence
- Main Signal Indicators (Any One): MA Cross (In-built) or Hull, OBV Cross, Heiken Ashi Cross
- Validation Indicators (Preferably less than 3): OBV (with Min Distance), Heiken Ashi, ADX, SuperTrend, PSAR, Higher TimeFrame EMA Alignment
- If MA Cross and OBV Cross both are false, only then Heiken Cross will be taken as Main Signal.