


Abiroid Donchian Scanner and Arrows
60 $
Coming soon on MQL5. Contact me.- Donchain Channel Break
- Min Channel Jump Points
- Max Tight Ranging Bars Before Jump
- Check High Volume
- MA Filter (Buy: Price > MA OR Sell: Price < MA)
- ADX > 25
- HTF Align SMA
All products are non-refundable. Since these are digital products. No source code available, only executables. Please read product description carefully before buying.
This strategy is useful for small timeframe scalping and binary options.
Best timeframes: M5,M15,M30
M1 timeframe is too unpredictable. So be careful with that.
Strategy:
- Donchain Channel Break
- Check High Volume
- MA Filter (Buy: Price > MA OR Sell: Price < MA)
- ADX > 25
- HTF Align SMA
Free Arrows Demo:
Arrows Demo only works in strategy tester. So, Arrows Demo won’t work with the free scanner.
Free Scanner:
Scanner needs “Abiroid Donchian Arrow.ex4” to work.
So make sure both arrows and scanner are in the same directory.
Scanner Refreshes every new bar. So keep scanner open for your min timeframe. E.g. If you use M5,M15,M30 then keep scanner on a chart with M5 timeframe.
Scanner .set file and arrows .set file are usable by both and interchangeable. Since they share the same Donchian Settings.
So if you make changes in Scanner, save it’s set file and use it in Arrows. And vice-versa.
For Purchase:
Once you purchase you will receive this Arrows Indicator:
Abiroid Donchian Arrow.ex4
Indicators Used:
- Donchian Channels:
- Volume Candles:
- MA: Use MT4 In-Built Moving Average
- ADX: Use MT4 In-Built ADX
Sample Template:
Sample template does not contain the Donchian Arrows or Scanner. Once you buy it, just add Abiroid Donchian Arrow.ex4 to this template with your preferred settings.
Video Tutorial:
Donchian Channel Breakouts:
Donchian is the main Signal. So it is a mandatory check.
The Donchian Channels draw the High and Low points for the past number of bars.
And when price breaks-out up/down, the channel extends up (new high)/down (new low). And we use these breakouts as a signal.
But there are a lot of breakouts. So we need to limit them and get only useful ones.
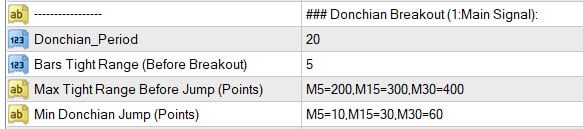
Donchian Period: Get Highs/Lows and draw channels for Past period number of bars
Max Tight Range Before Jump (Points):
Best breakouts occur when price breaks out of a tight range and enters a trend.
This is the Max point distance between upper and lower channels. Since different timeframes will have different distances, you can specify a comma-separated list like this:
M5=200,M15=300,M30=400
This means that on M5, the max distance (in points) between upper and lower bands should be less than 200 points. For past “Bars Tight Range” number of bars right before breakout.
Bars Tight Range:
The total number of bars to check right before breakout (for finding the Tight Range).
Keeping this value too high will limit the signals a lot.
To disable checking Tight Range, keep it to 0.
Min Donchian Jump (Points):
This indicates min number of points for a Donchian breakout Jump. It should be lower for smaller timeframes and higher for larger timeframes.
So, it is a comma separated list like this: M5=10,M15=30,M30=60,H1=120
This means that for M5 min jump should be at least 10 points.
For M15, jump should be 30 points and so on. This will limit very short donchian breakouts and only give us good strong breakouts.
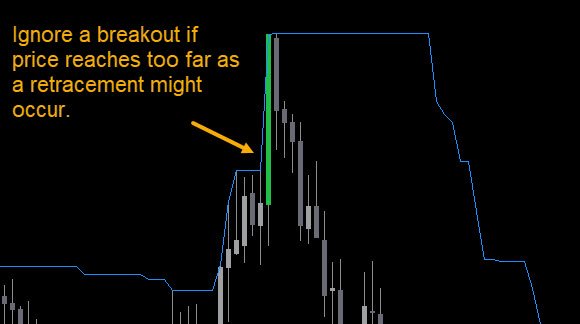
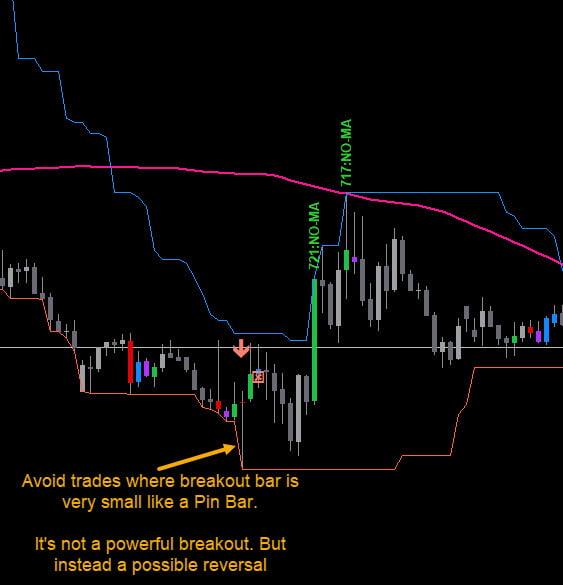
Types of Signals to Avoid:
- If a breakout is too large and price has already reached too far, then ignore it, as price might retrace after it:
- If a breakout bar is too small – ignore it because it means a possible reversal:
- Also ignore signals if market feels too choppy and unpredictable (usually near news events):
Other Filters:
In order to further remove bad signals, you can use these filters. They will help validate good profitable signals.
And filter out less profitable signals.
Volume Check:
Use this to get strong volume candles when breakout happens.
Num Bars Volume Check:
This will check past bars for High volume, and at least one of these past candles should have good volume for a good breakout.
By default it is 1. Meaning it will only check the breakout candle for good volume.
You can look for high or medium volume candles. By default, it won’t use medium volume candles. Only High Volume ones.
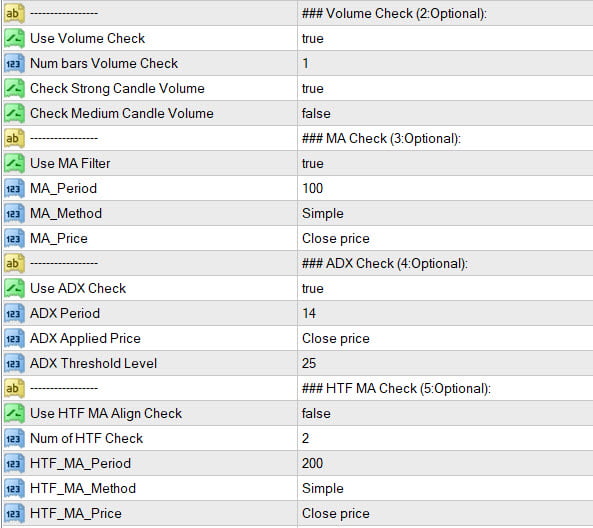
MA Check:
You can set the MA Type. By default it will use 100 Simple Moving Average to filter out signals.
For Bullish Breakouts, price should be above this SMA. For Bearish Breakouts, price should be below this SMA.
ADX Check:
It will check ADX Value to be above Threshold set. By default ADX should be above 25 value.
HTF MA Check:
This check is useful if you are trading higher timeframes for longer term trends. Keep it off for scalping and binary options.
This will check TF alignment with next higher timeframes for Moving Average Trend. For Bullish, price in current and Higher TFs should be above HTF MA. And for Bearish price should be below HTF MA. You can specify the number of Timeframes you need to check starting with current TF.
This will limit the signals a lot. So it is kept off by default.
Other Settings:
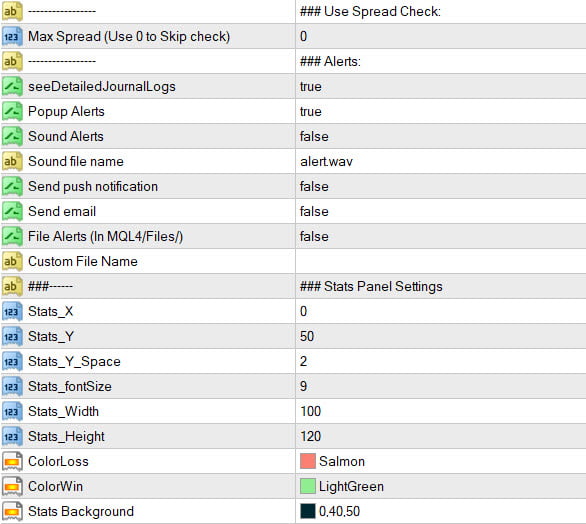
Use Max Spreads to avoid trading pairs with very high spreads.
Set types of alerts. And customize the Stats panel to your liking.
See Scanner common settings:
https://abiroid.com/indicators/abiroid-scanner-dashboard-common-settings
For Binary Options:
You can set number of Binary Expiry bars. And Max Past Bars to scan for signals.
It will use these to get Win Percentage rates. Not all pairs are profitable, all the time. These percentages will help you find best possible trades.
Note, default settings are very restrictive. So you will get fewer signals.
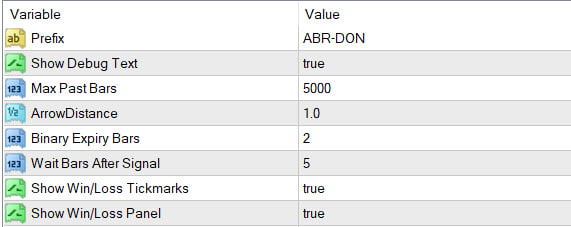
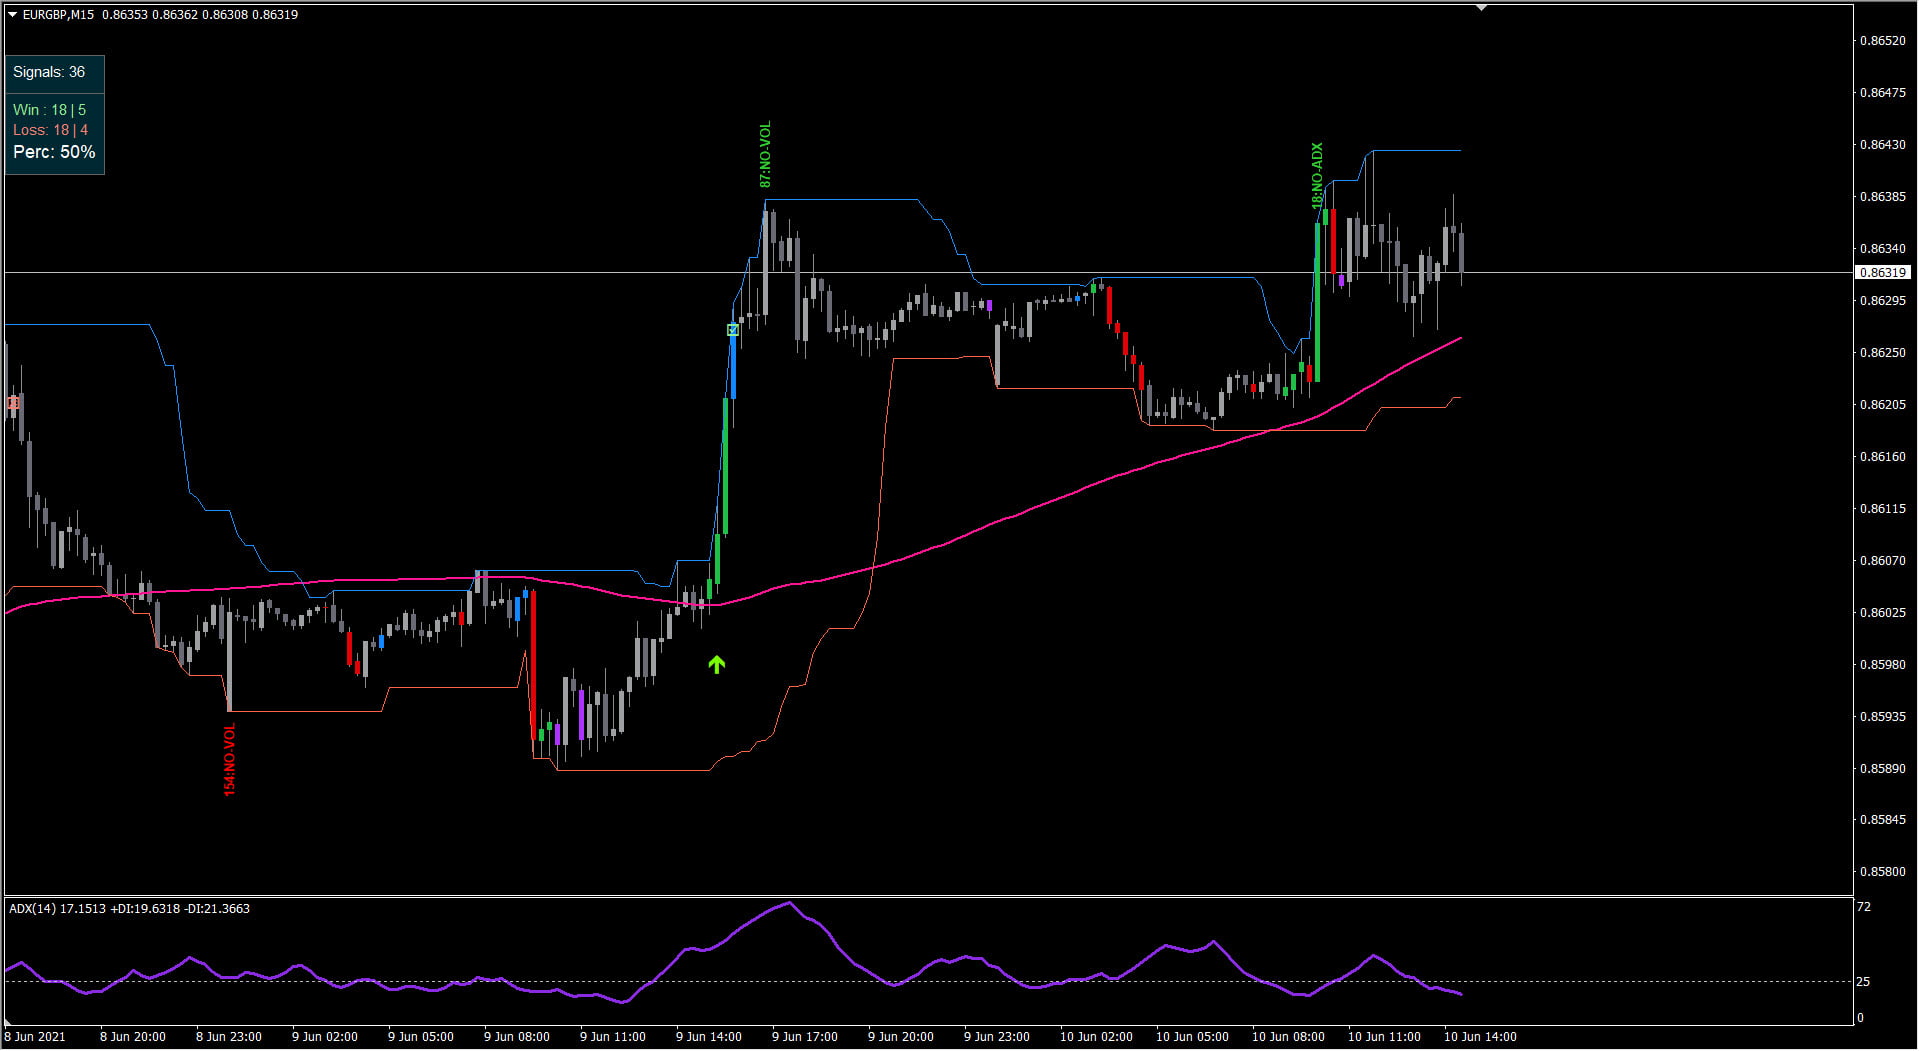
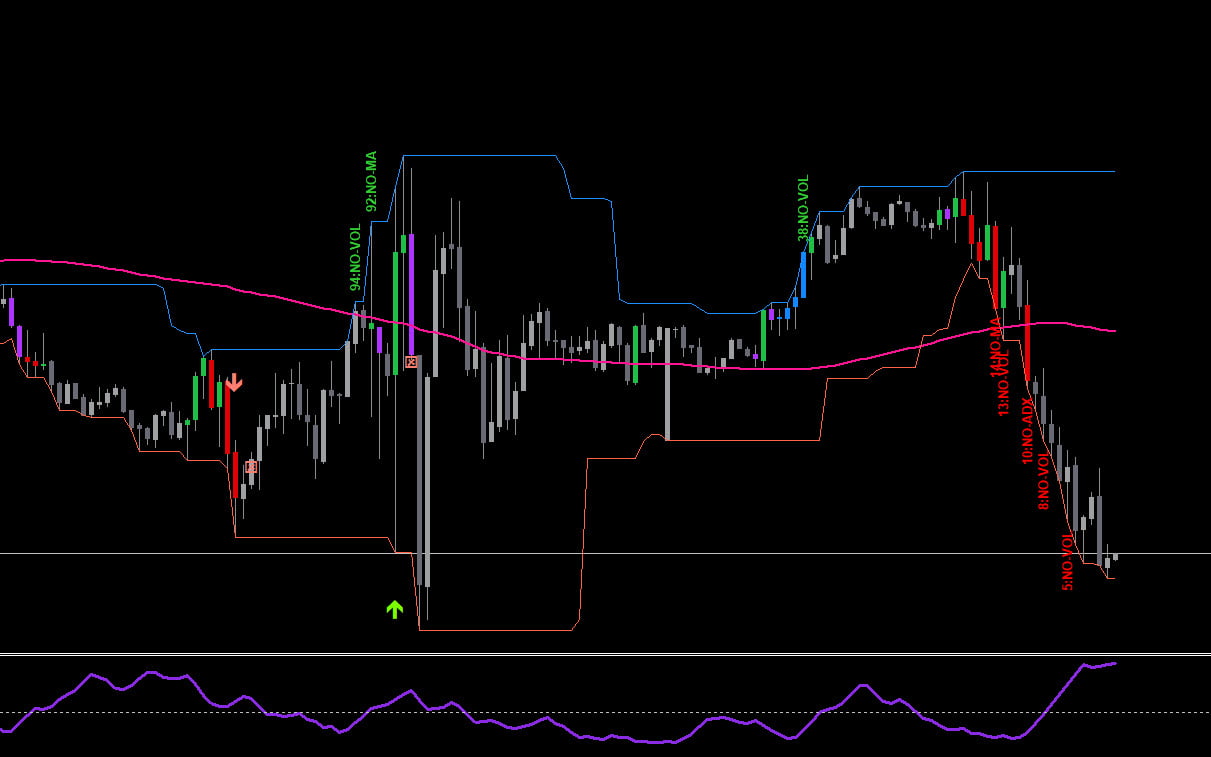
If Show Debug Text is true, you will see these texts on candles showing why a signal was ignored:
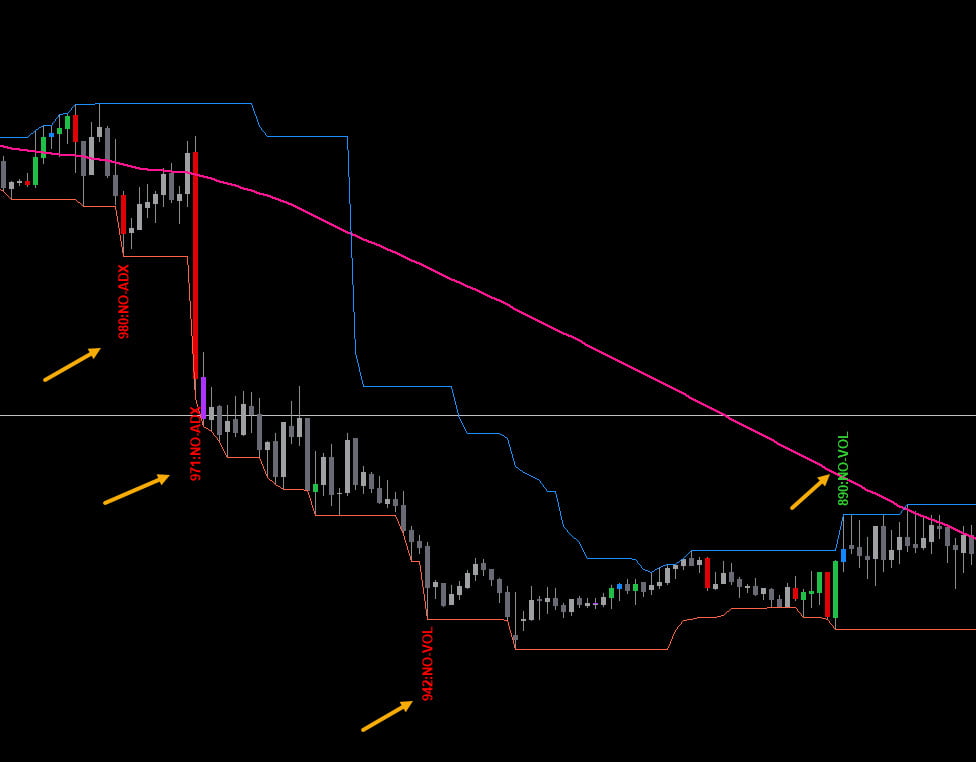
Keep it false, if these texts are too distracting.
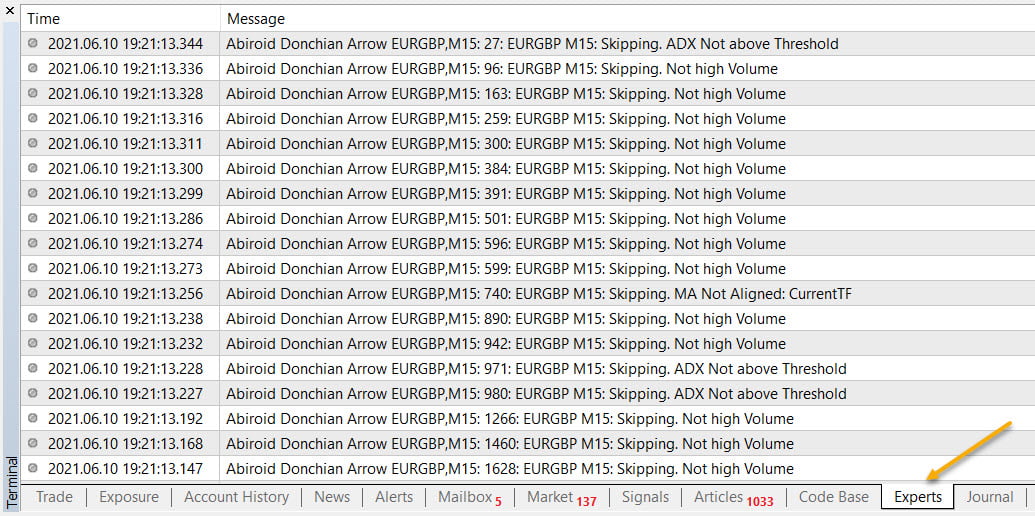
If ShowJournalLogs is true, it will also give logs in Experts tab and show why a signal was skipped along with bar number.
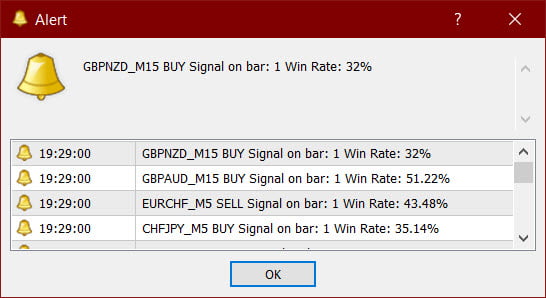
Scanner Alerts:
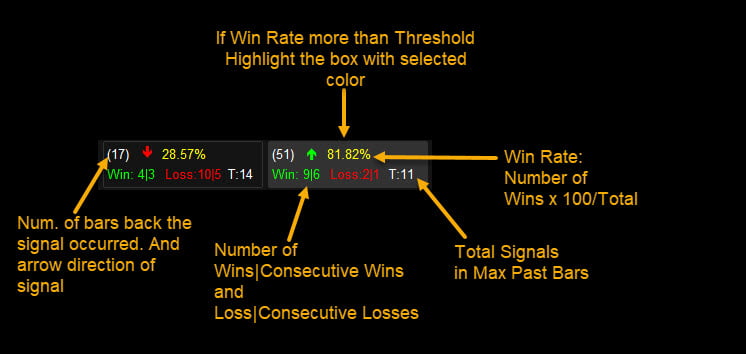
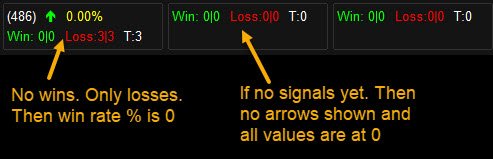
Scanner Alerts show Buy/Sell signal along with Win Rate Percentage.
So you can ignore signals like these with lower win-rate:
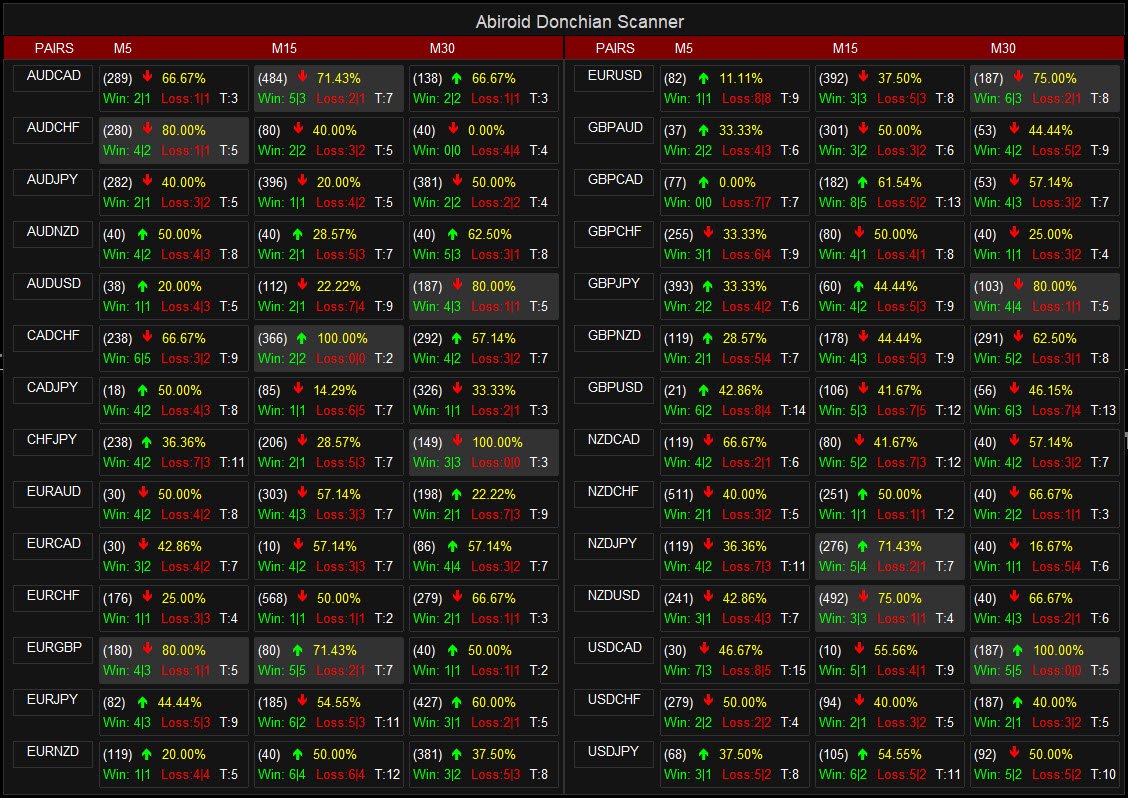
Reading the Scanner:
Known Metatrader Limitations:
And when using all 28-pairs, scanner works best for 3 timeframes and 500 past bars. And about 5 bars in Tight Range calculations.
If you use too many past bars to calculate Tight Range, scanner will be slow.
And might give an Out of memory error in Experts tab.
This is because the scanner performs a lot of complex Binary options calculations. To calculate the win/loss rates.
And metatrader only supports a limited amount of memory.
So, use fewer pairs or fewer past bars or fewer Tight Range Calculations.
Changelog:
v1.0 Base version
v1.1 HTF Align MA check will start from next higher timeframe
Since MA Current timeframe is already there
Related products


Abiroid Fibo and Pivot Scanner with Missed Pivots
- Select separate Pivot Timeframes for each Dashboard Timeframe
- Check when price is near a Pivot point
- Check for Price Crossing Pivot Point
- Use Mid Pivots (Optional)
- Show Missed Pivots (Optional)
- Show High Volume Bar
- Use Fibo (Optional)
- Use Fibo Golden Ratio (Optional)
- Set your preferred Timeframe for Fibo or Pivots

Abiroid Auto Fibo Indicator
- Blue Diamond if price Price crosses towards Trend
- Orange Diamond if price reverses towards retracement

ProfitPercent Arrows MA Confluence
- Main Signal Indicators (Any One): MA Cross (In-built) or Hull, OBV Cross, Heiken Ashi Cross
- Validation Indicators (Preferably less than 3): OBV (with Min Distance), Heiken Ashi, ADX, SuperTrend, PSAR, Higher TimeFrame EMA Alignment
- If MA Cross and OBV Cross both are false, only then Heiken Cross will be taken as Main Signal.
